Visualize how degrees of freedom affect the shape of t distribution, visualize quantiles out of given probability and probability from a given quantile.
Examples
# visualize t distribution
vdist_t_plot()
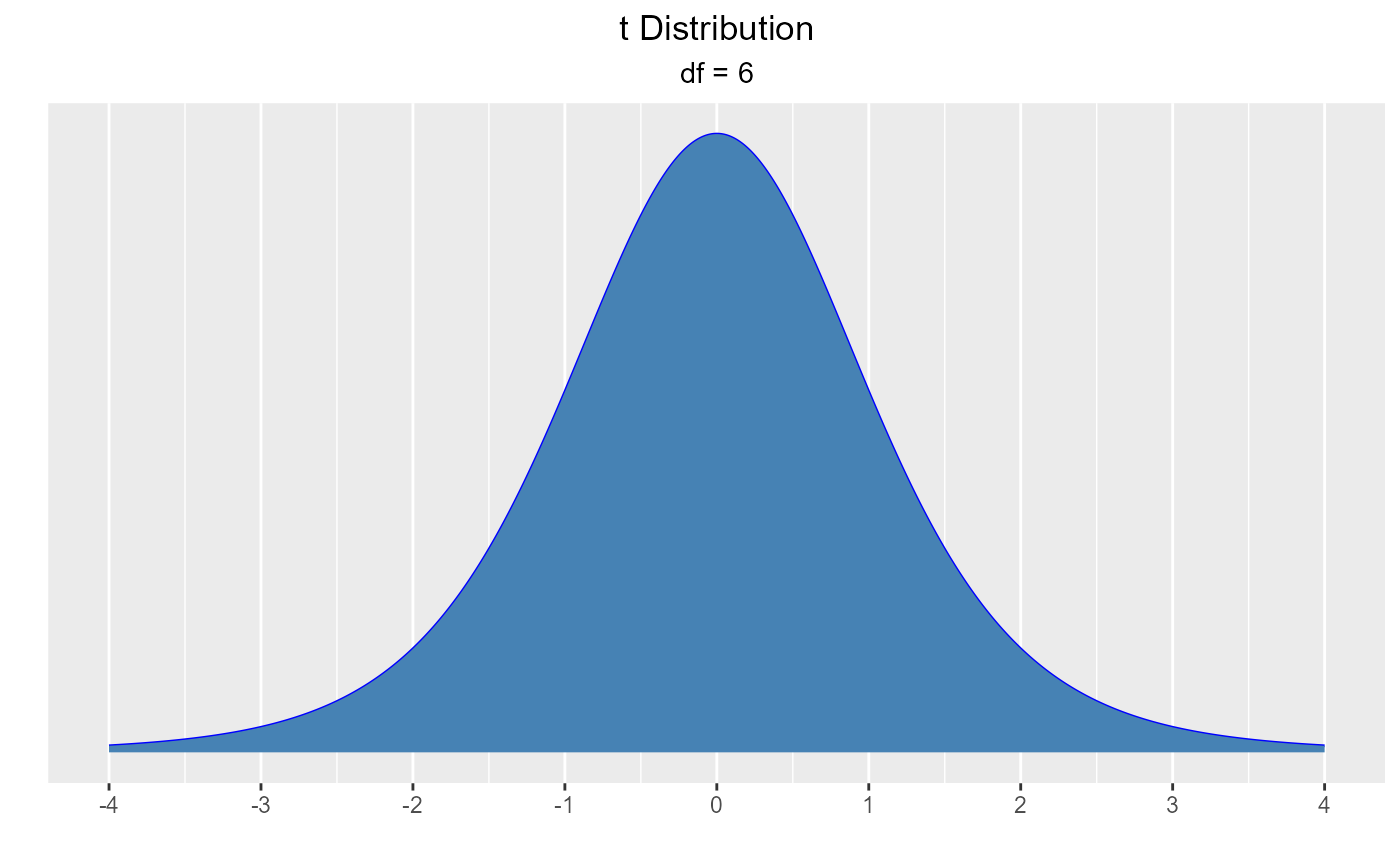
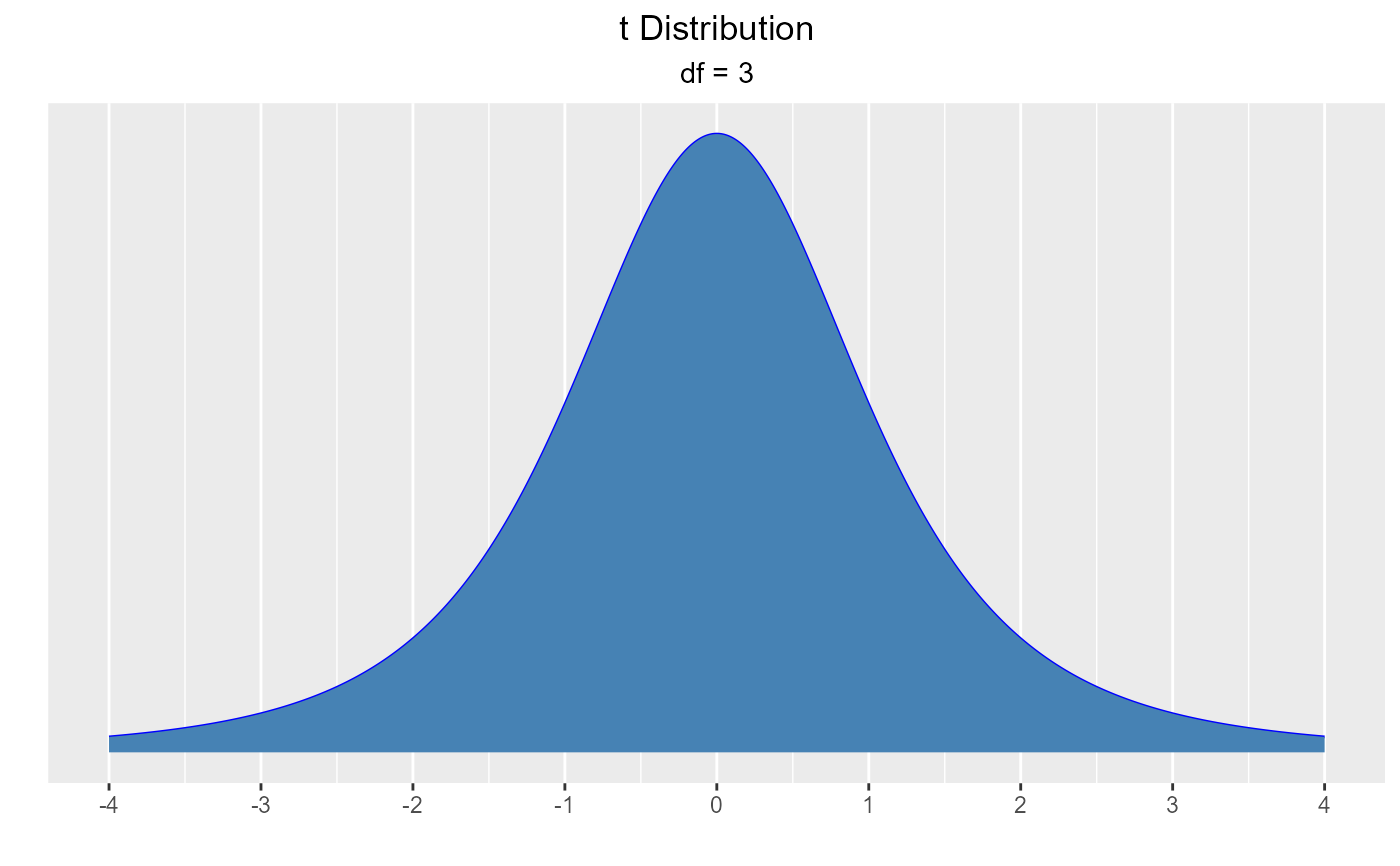 vdist_t_plot(6)
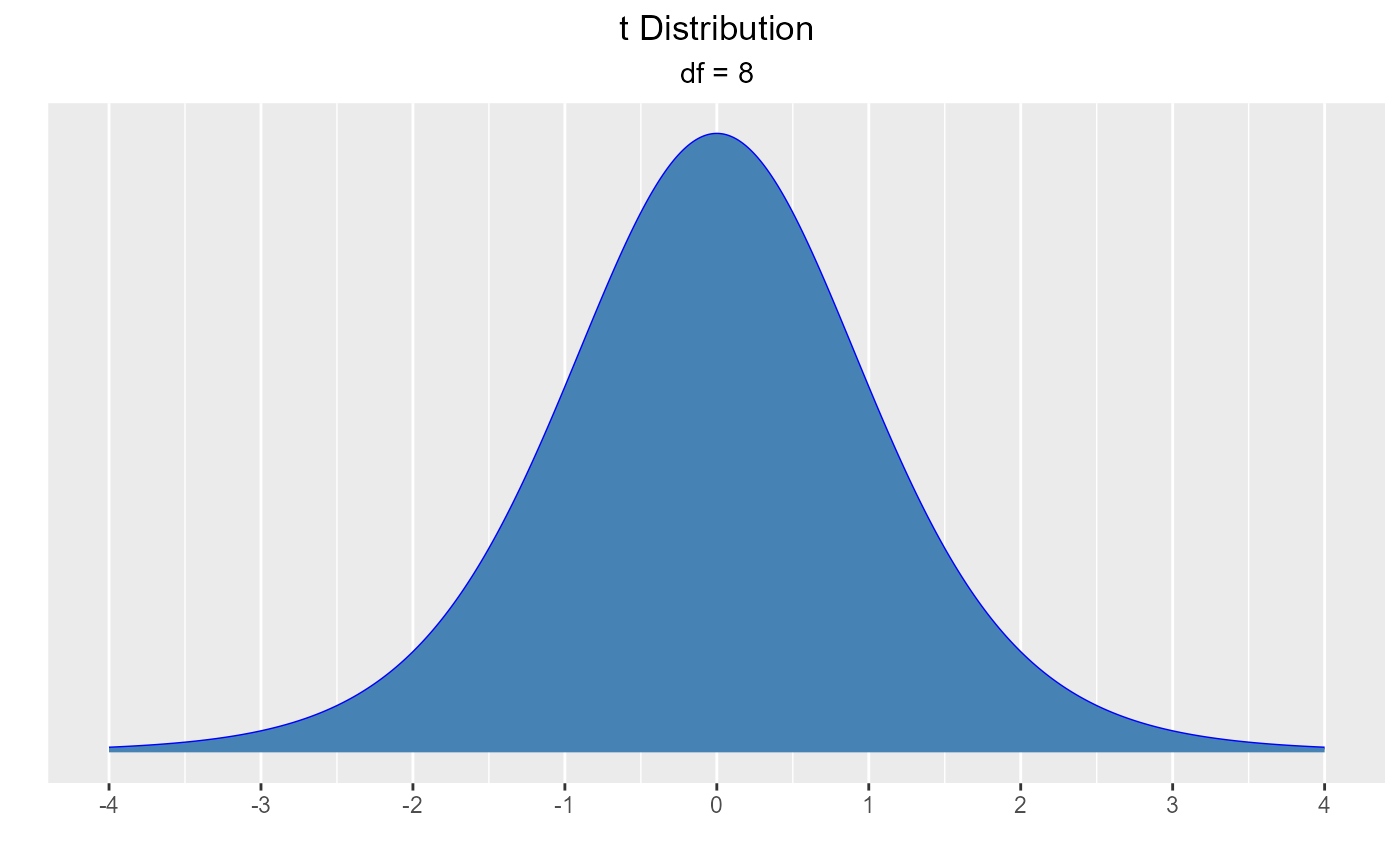
 vdist_t_plot(df = 8)
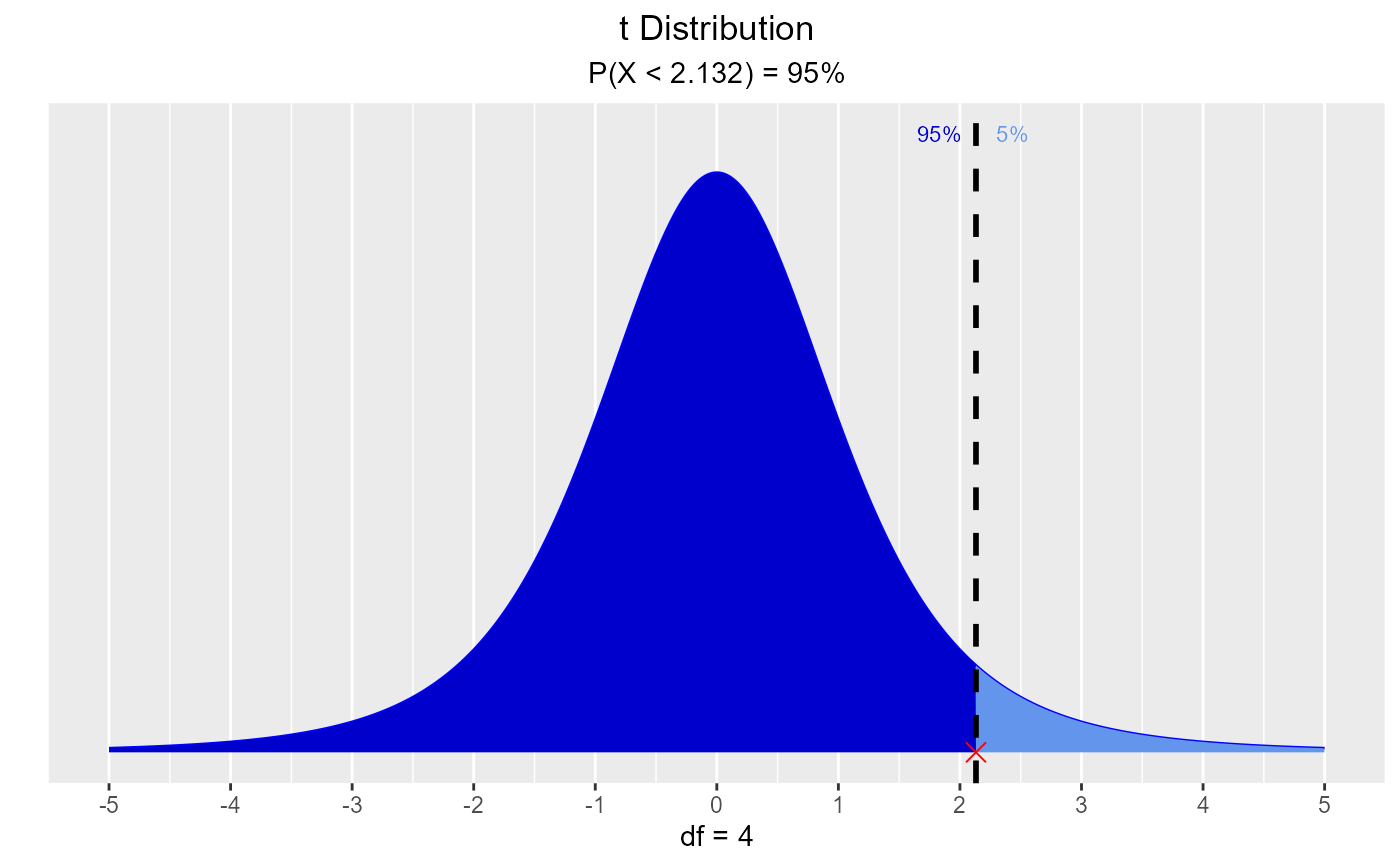
 # visualize quantiles out of given probability
vdist_t_perc(probs = 0.95, df = 4, type = 'lower')
# visualize quantiles out of given probability
vdist_t_perc(probs = 0.95, df = 4, type = 'lower')
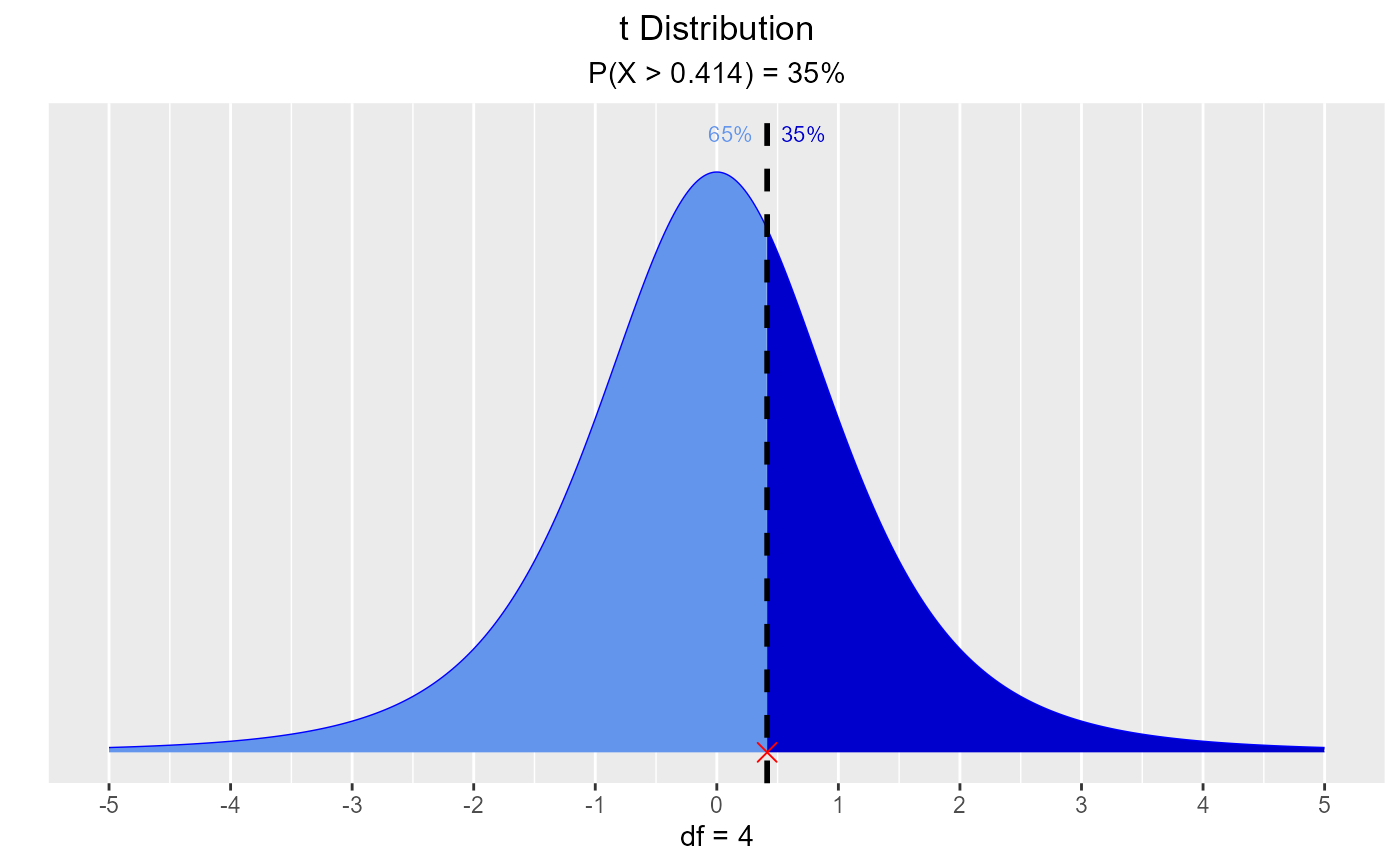
 vdist_t_perc(probs = 0.35, df = 4, type = 'upper')
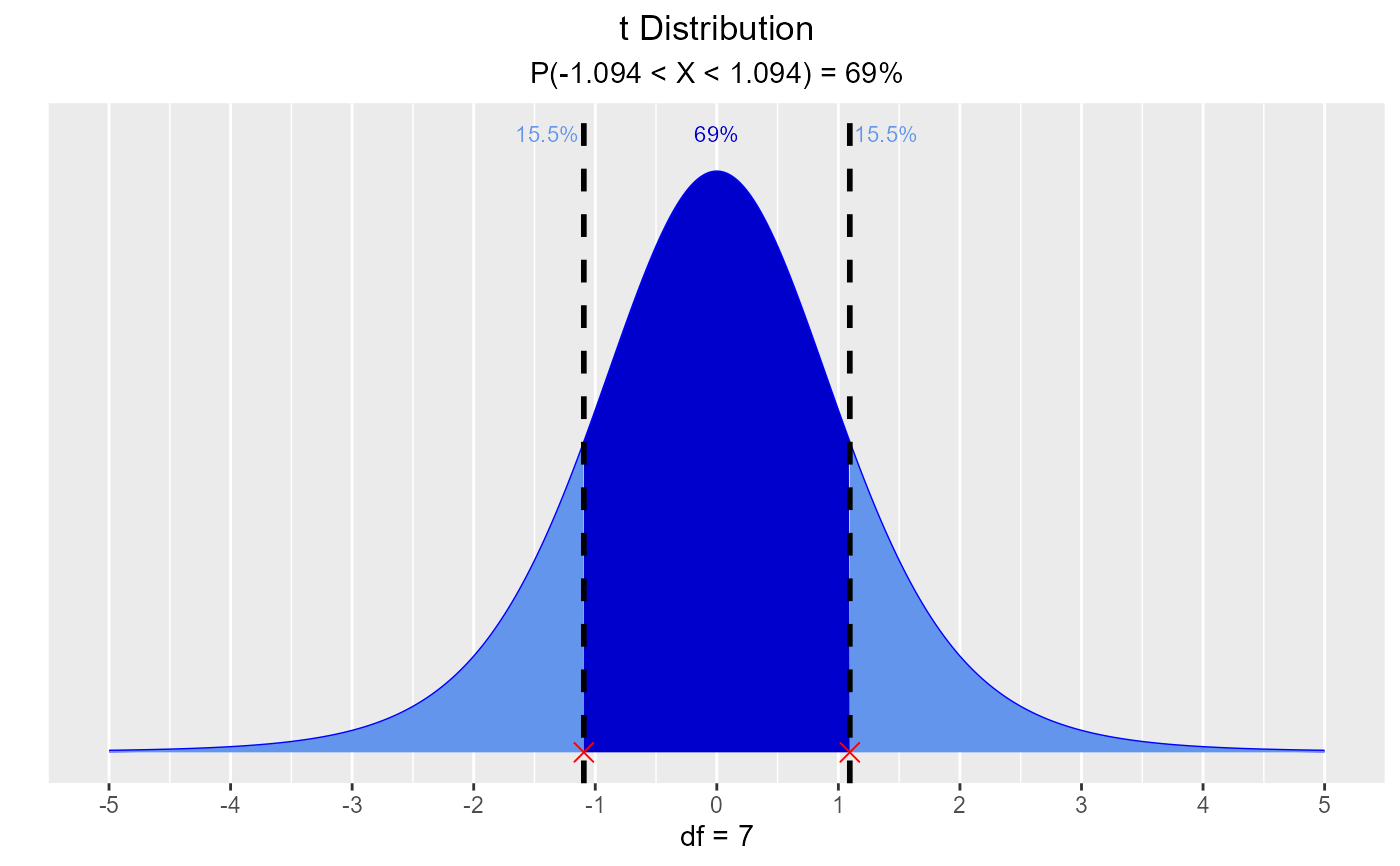
 vdist_t_perc(probs = 0.69, df = 7, type = 'both')
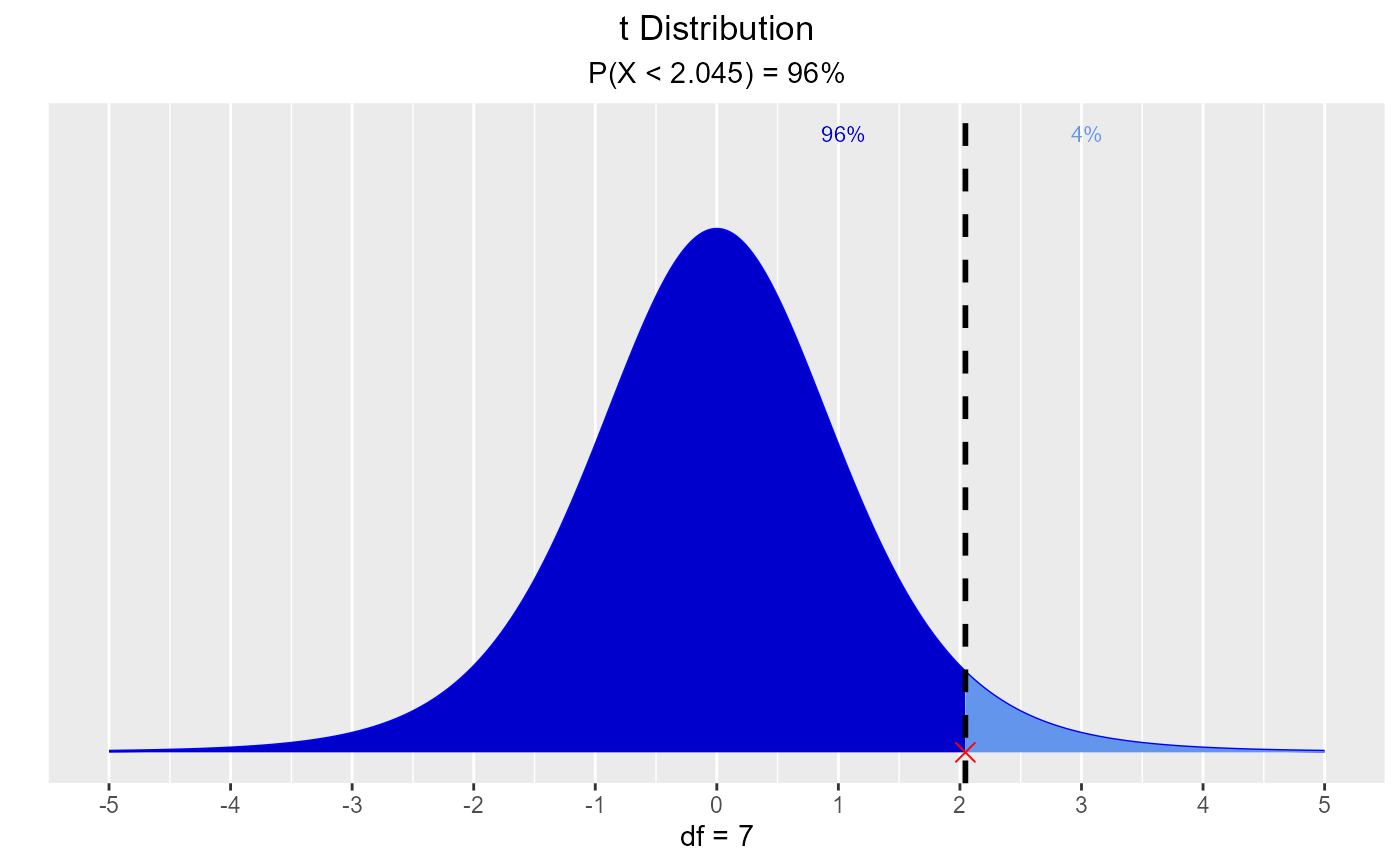
 # visualize probability from a given quantile
vdist_t_prob(2.045, 7, 'lower')
# visualize probability from a given quantile
vdist_t_prob(2.045, 7, 'lower')
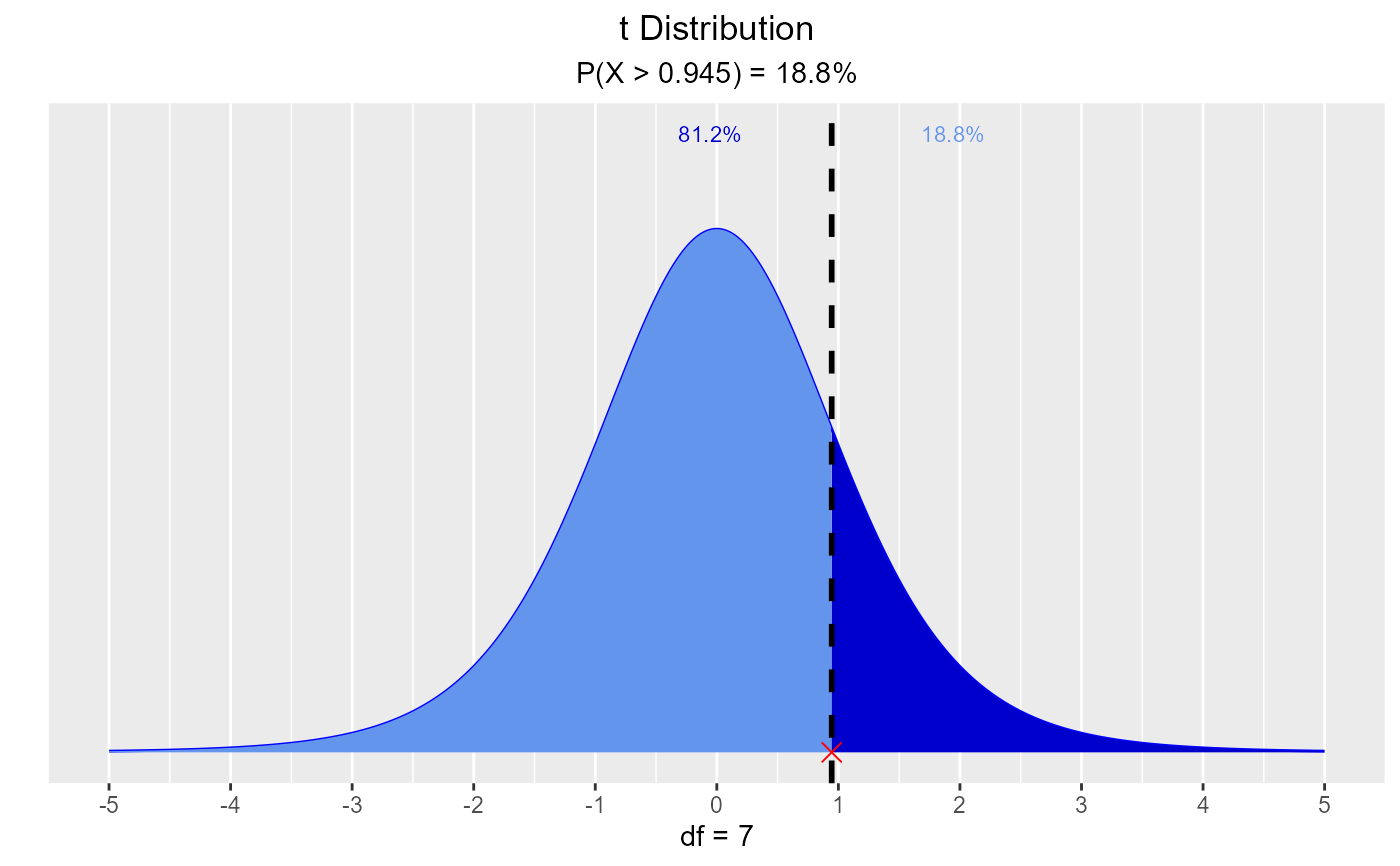
 vdist_t_prob(0.945, 7, 'upper')
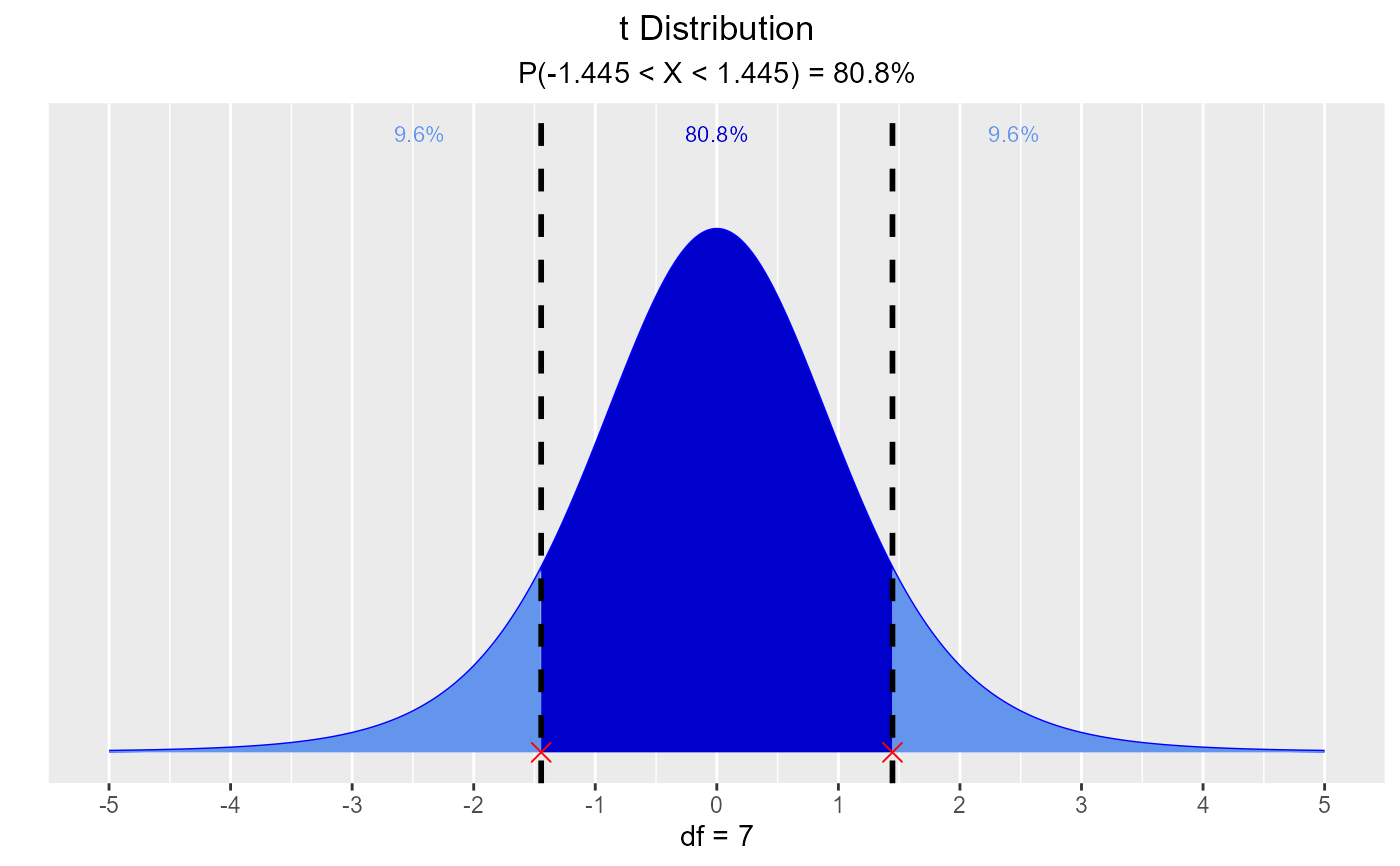
 vdist_t_prob(1.445, 7, 'interval')
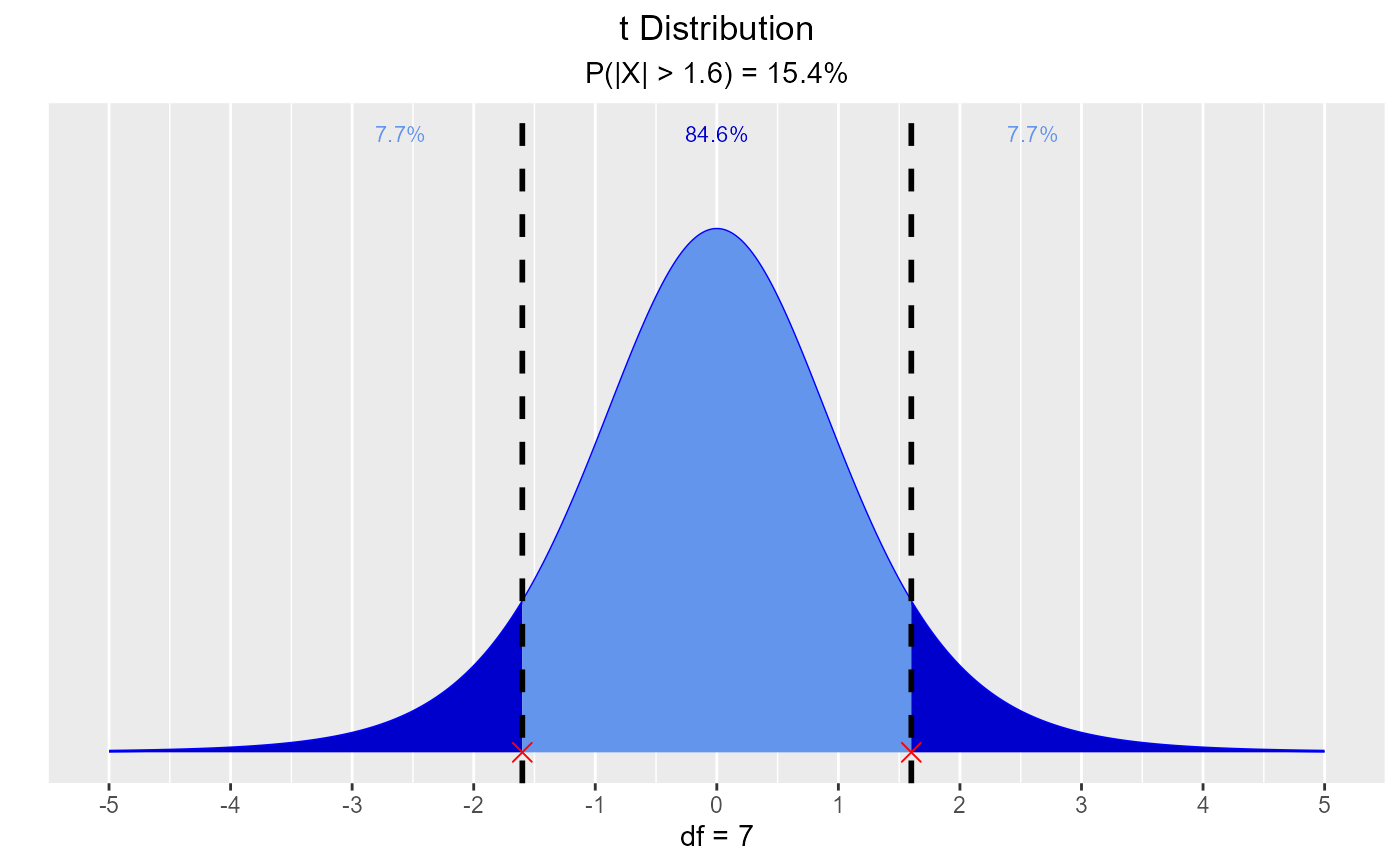
 vdist_t_prob(1.6, 7, 'both')