Visualize how changes in mean and standard deviation affect the shape of the normal distribution. Compute & visualize quantiles out of given probability and probability from a given quantile.
Examples
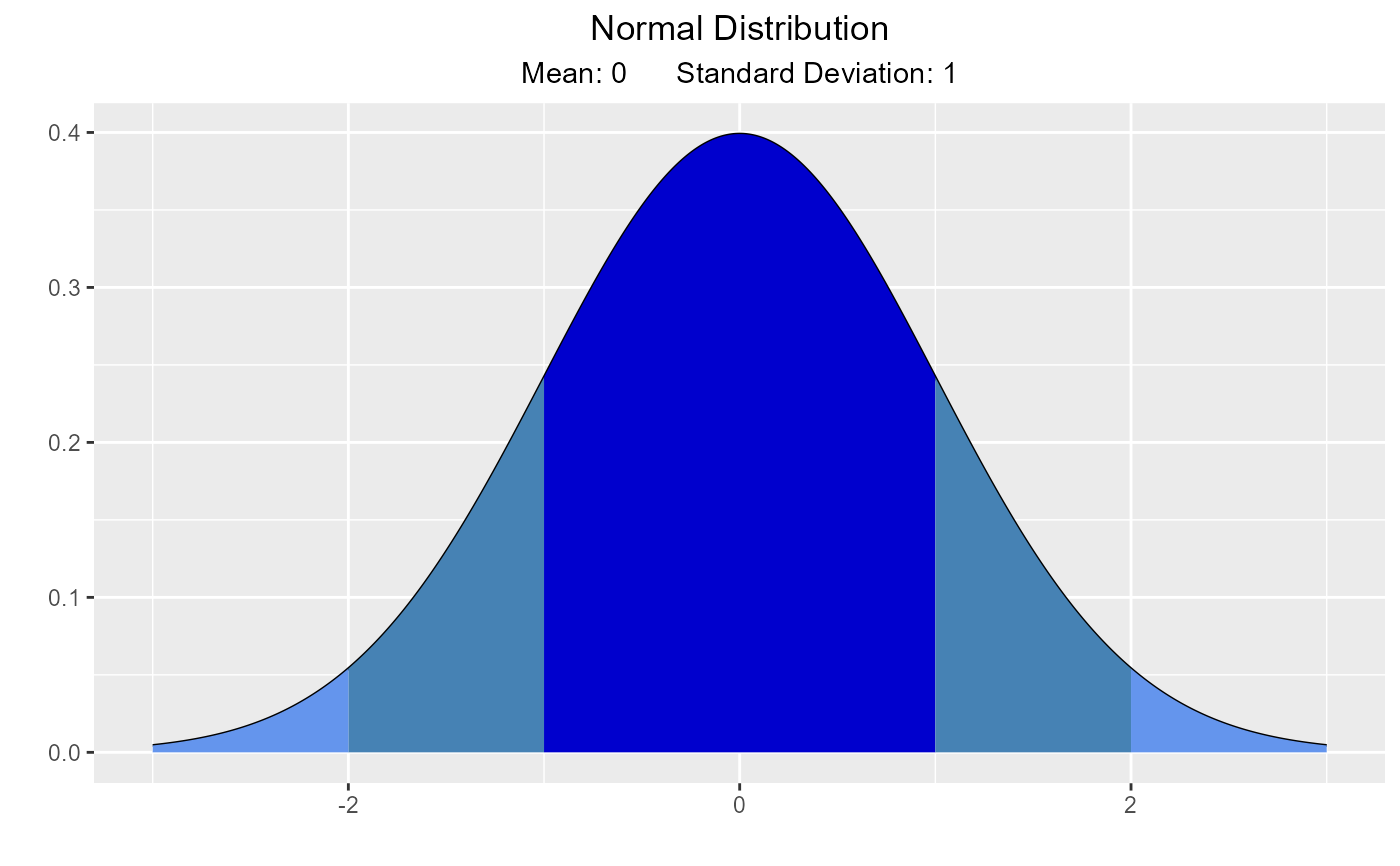
# visualize normal distribution
vdist_normal_plot()
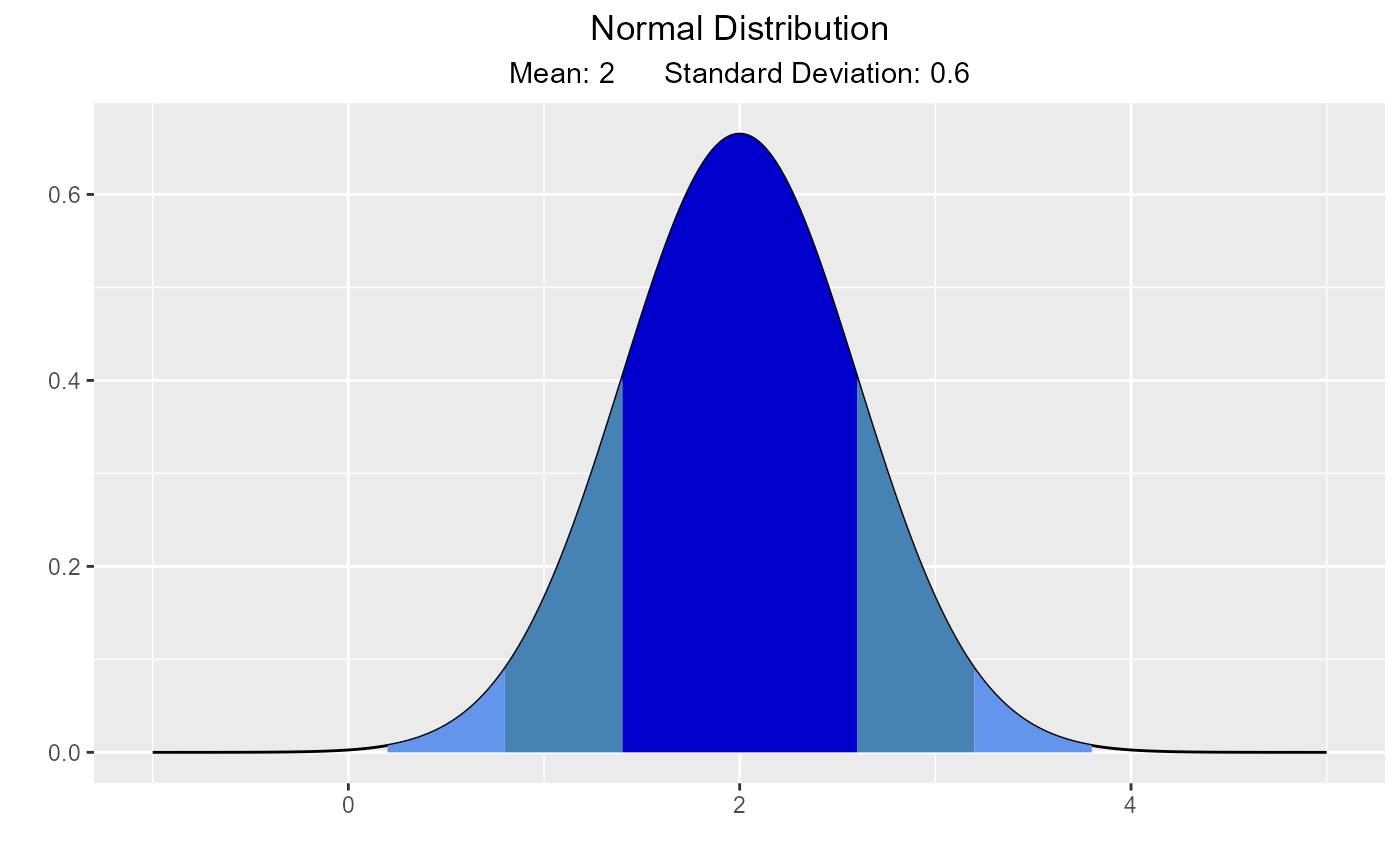
 vdist_normal_plot(mean = 2, sd = 0.6)
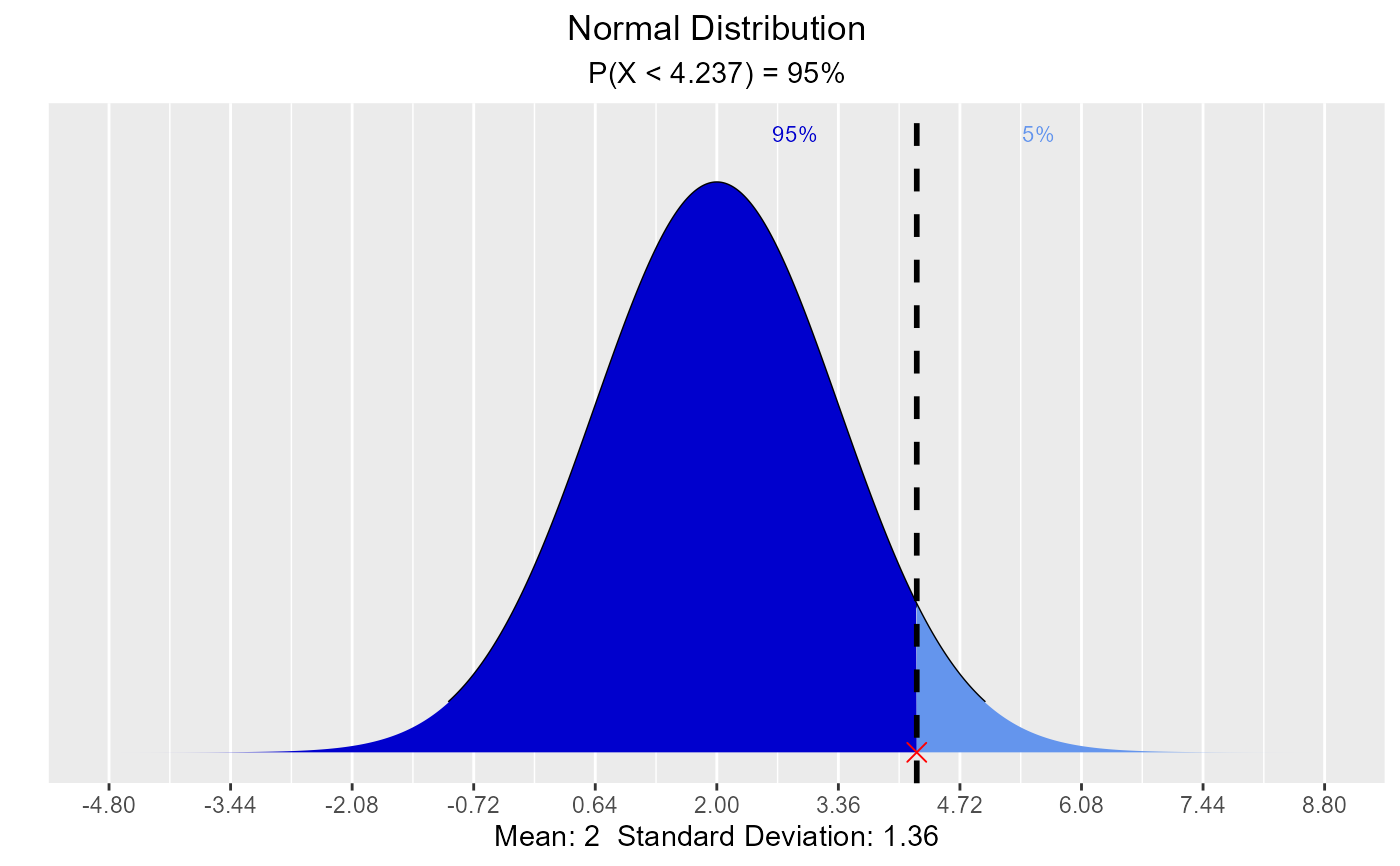
 # visualize quantiles out of given probability
vdist_normal_perc(0.95, mean = 2, sd = 1.36)
# visualize quantiles out of given probability
vdist_normal_perc(0.95, mean = 2, sd = 1.36)
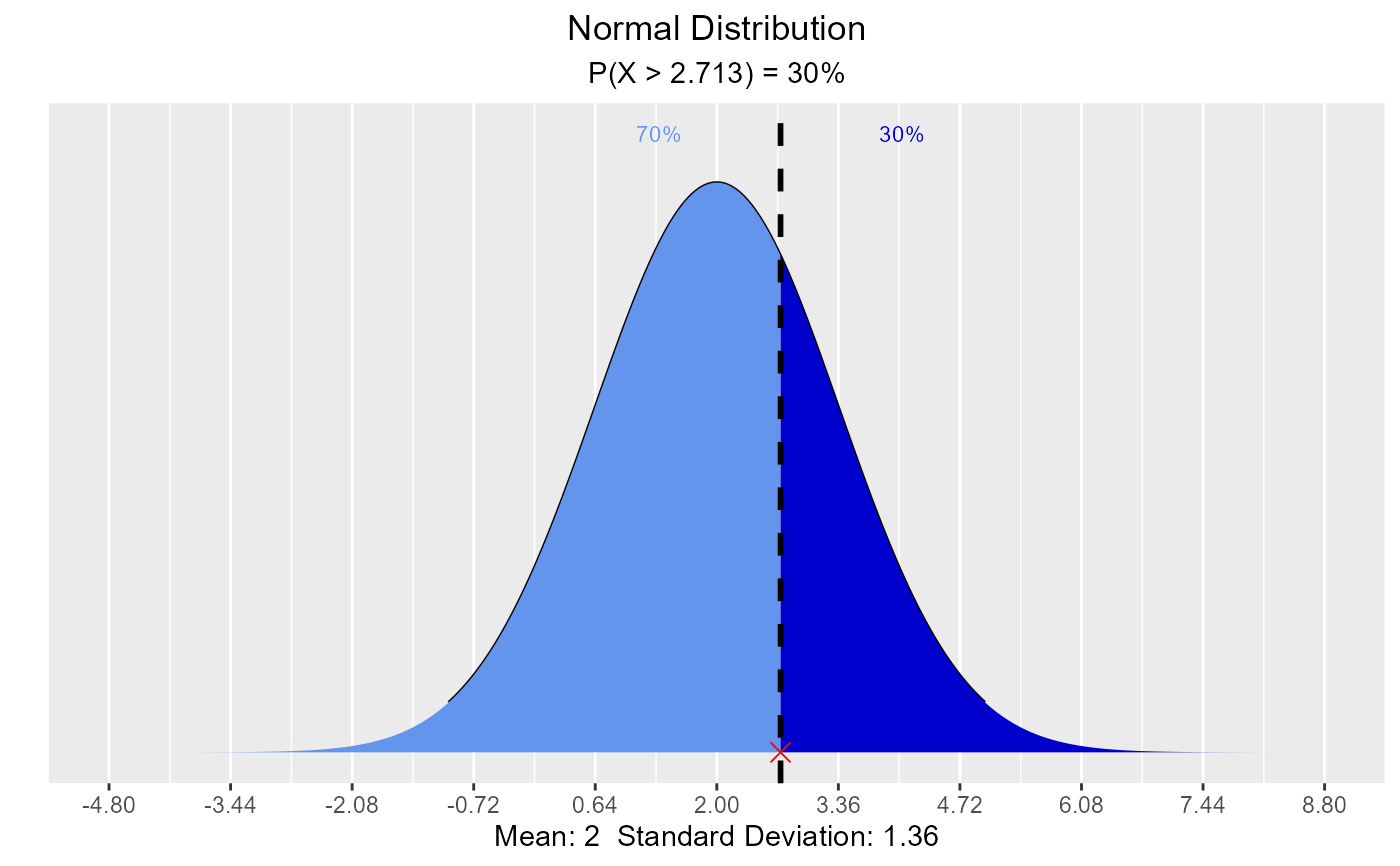
 vdist_normal_perc(0.3, mean = 2, sd = 1.36, type = 'upper')
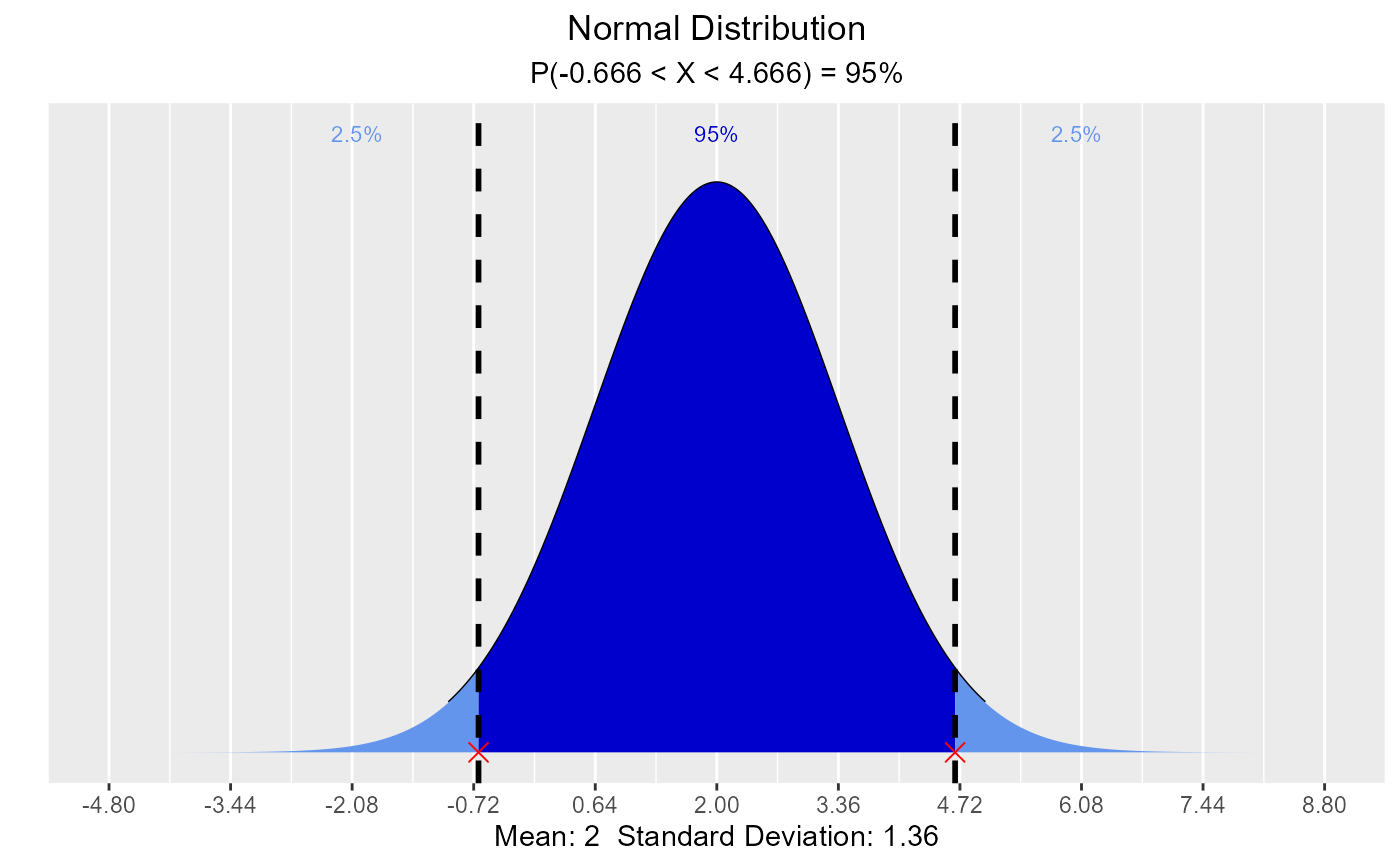
 vdist_normal_perc(0.95, mean = 2, sd = 1.36, type = 'both')
 # visualize probability from a given quantile
vdist_normal_prob(3.78, mean = 2, sd = 1.36)
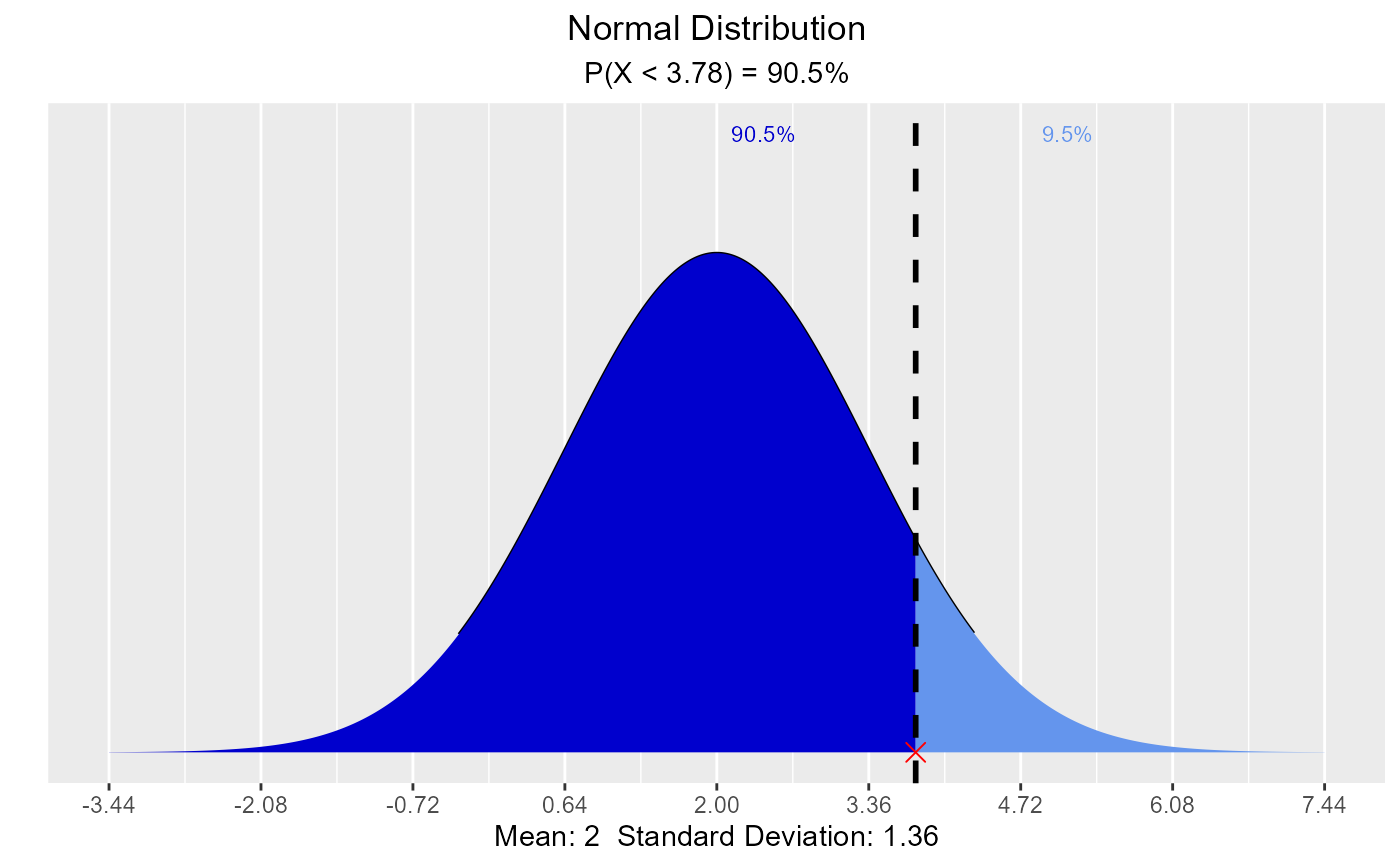
# visualize probability from a given quantile
vdist_normal_prob(3.78, mean = 2, sd = 1.36)
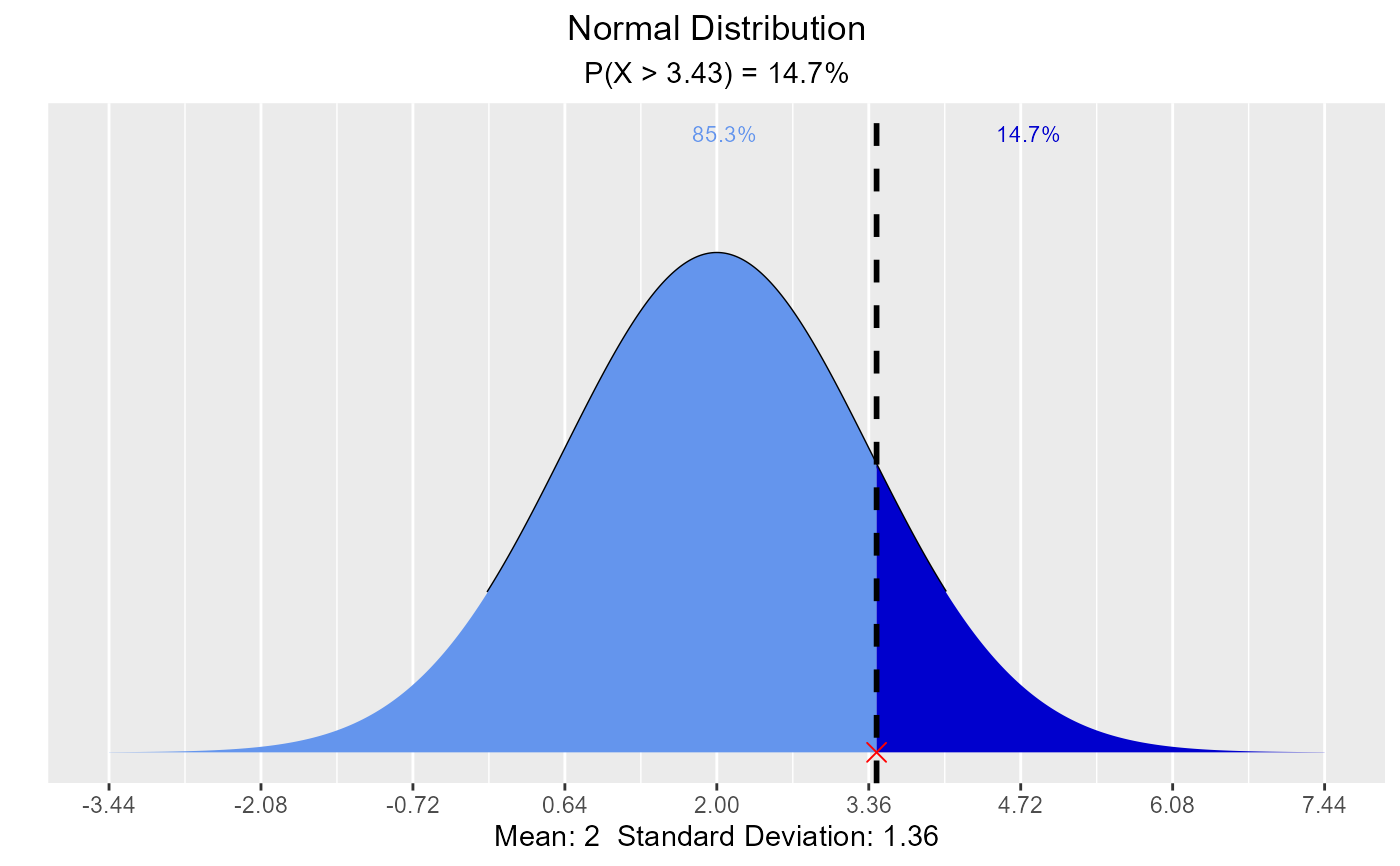
 vdist_normal_prob(3.43, mean = 2, sd = 1.36, type = 'upper')
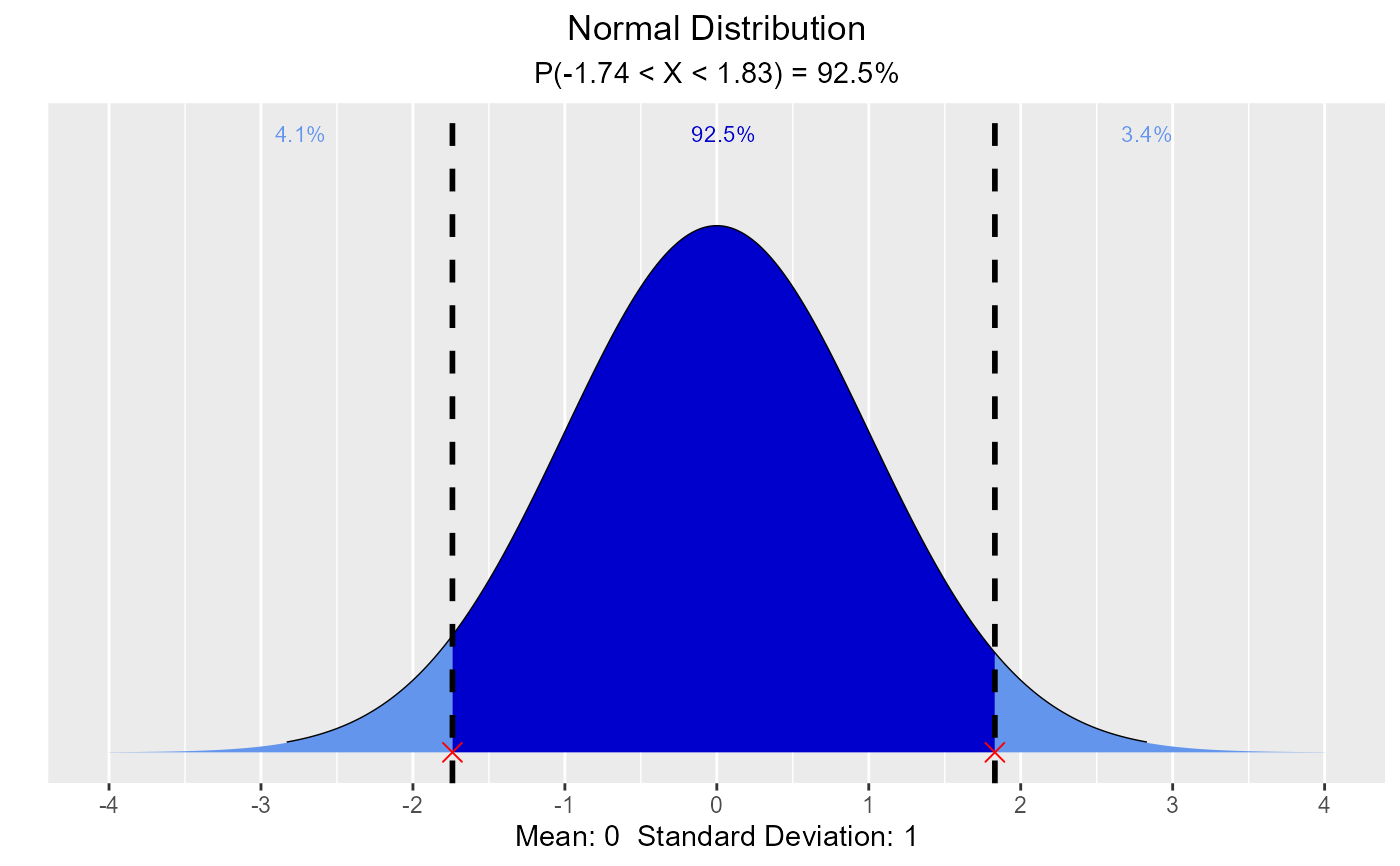
 vdist_normal_prob(c(-1.74, 1.83), type = 'both')