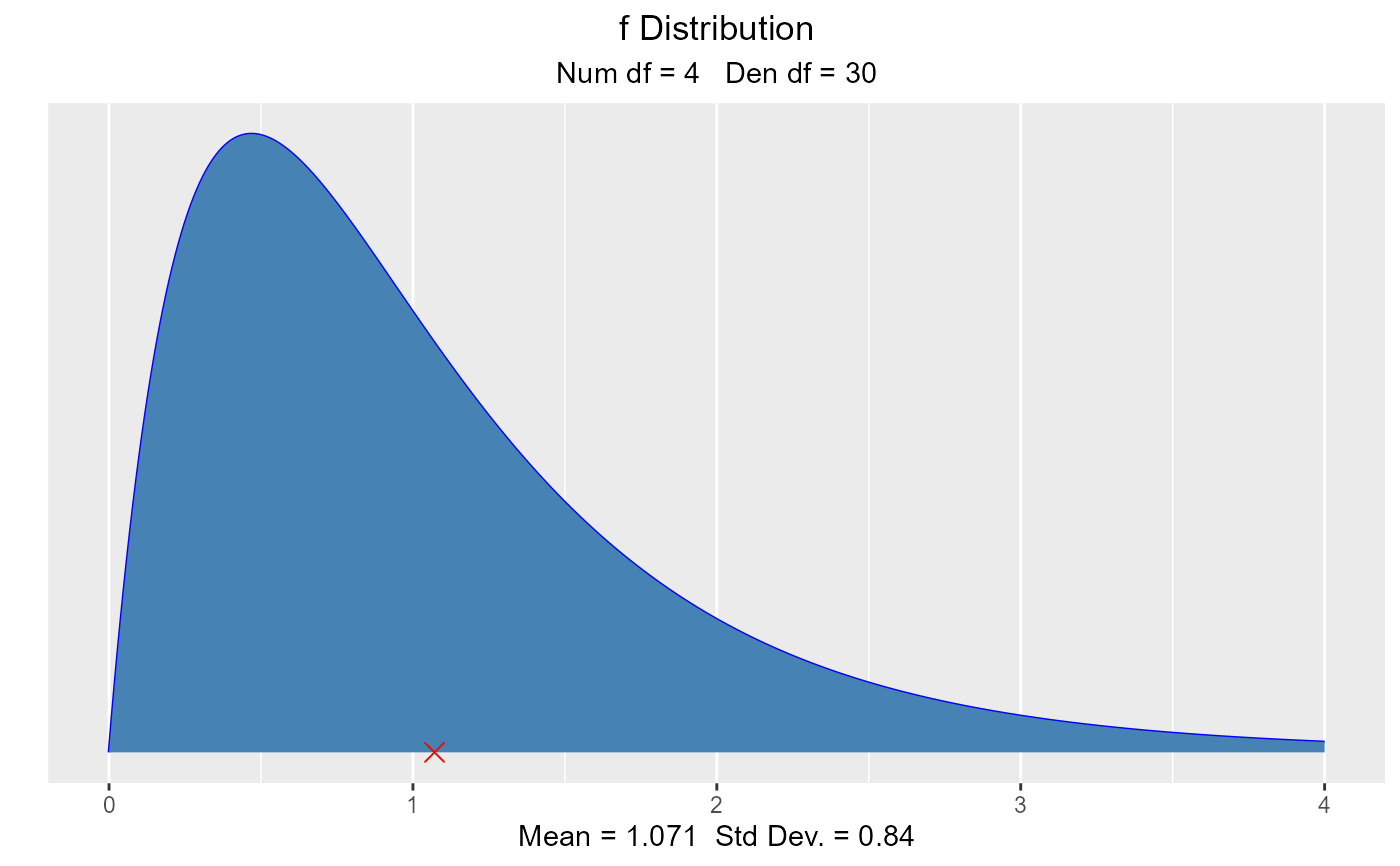
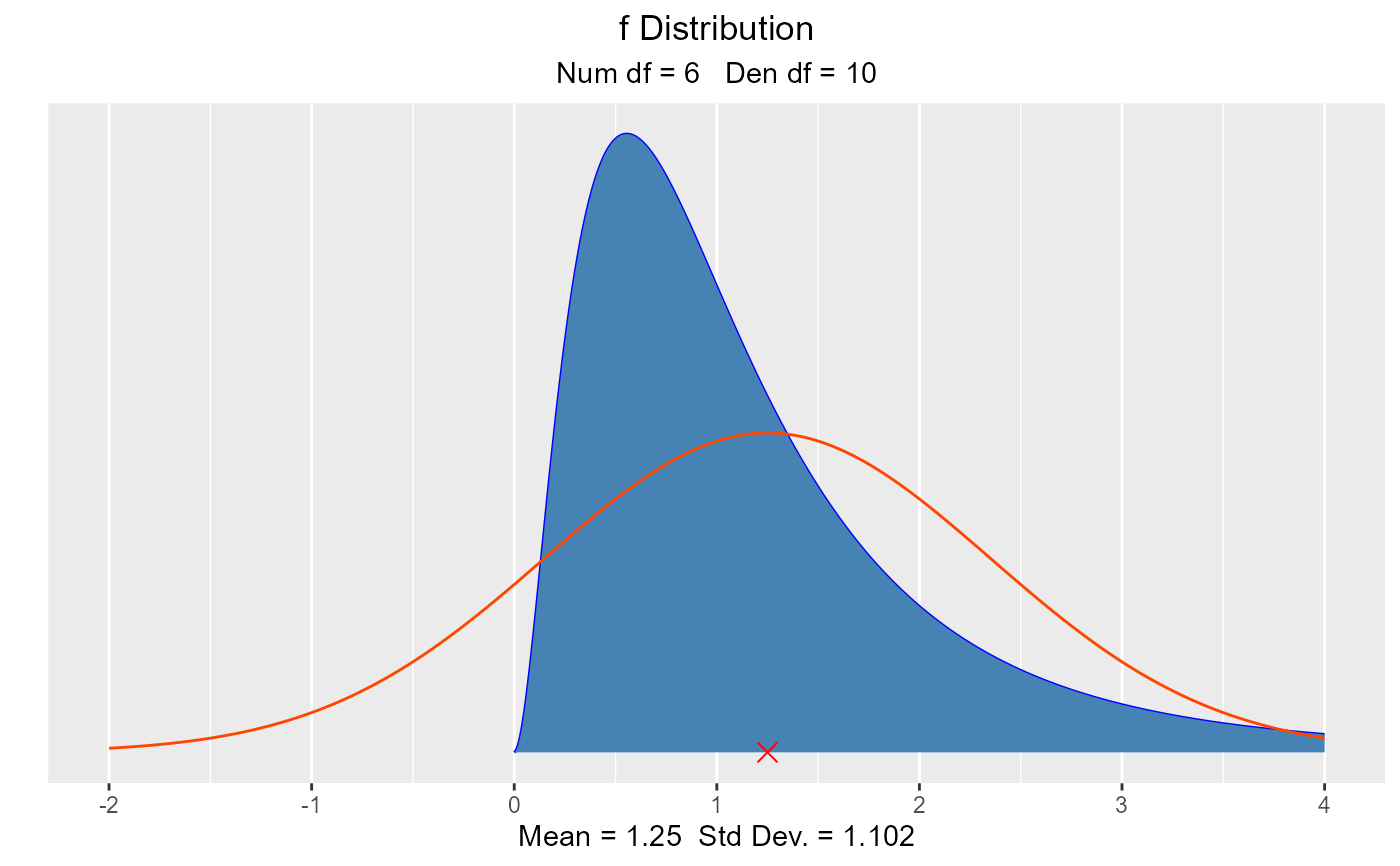
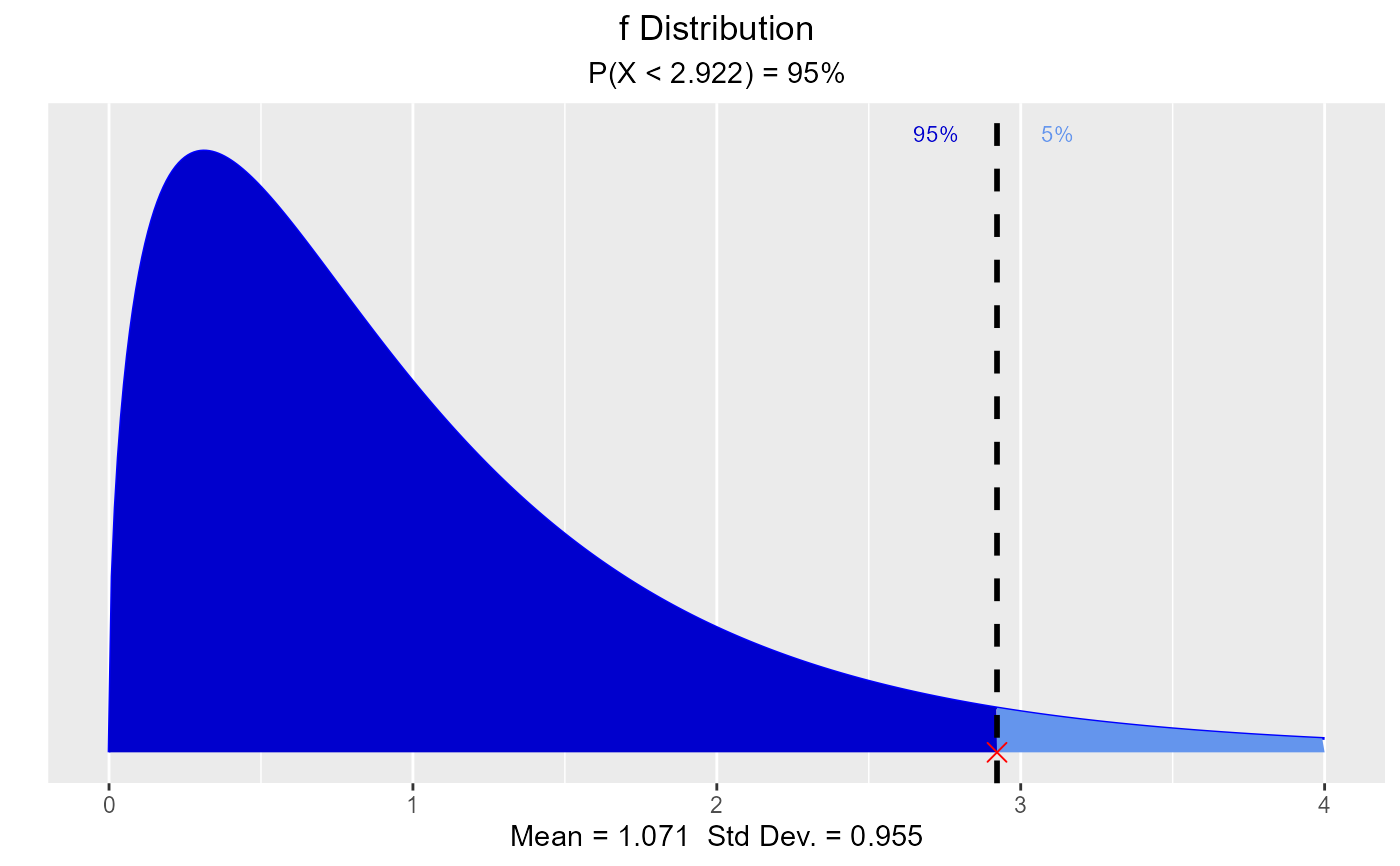
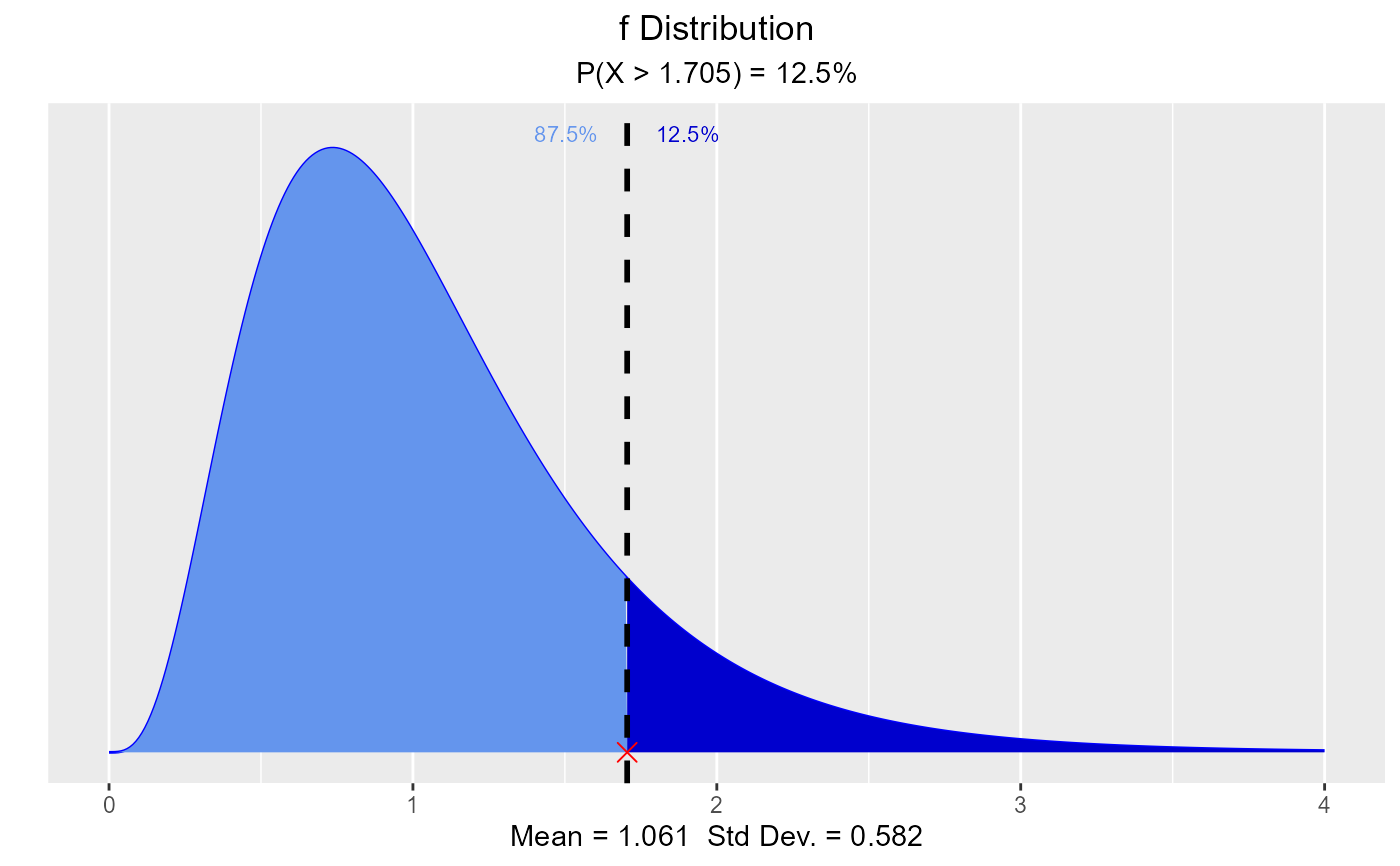
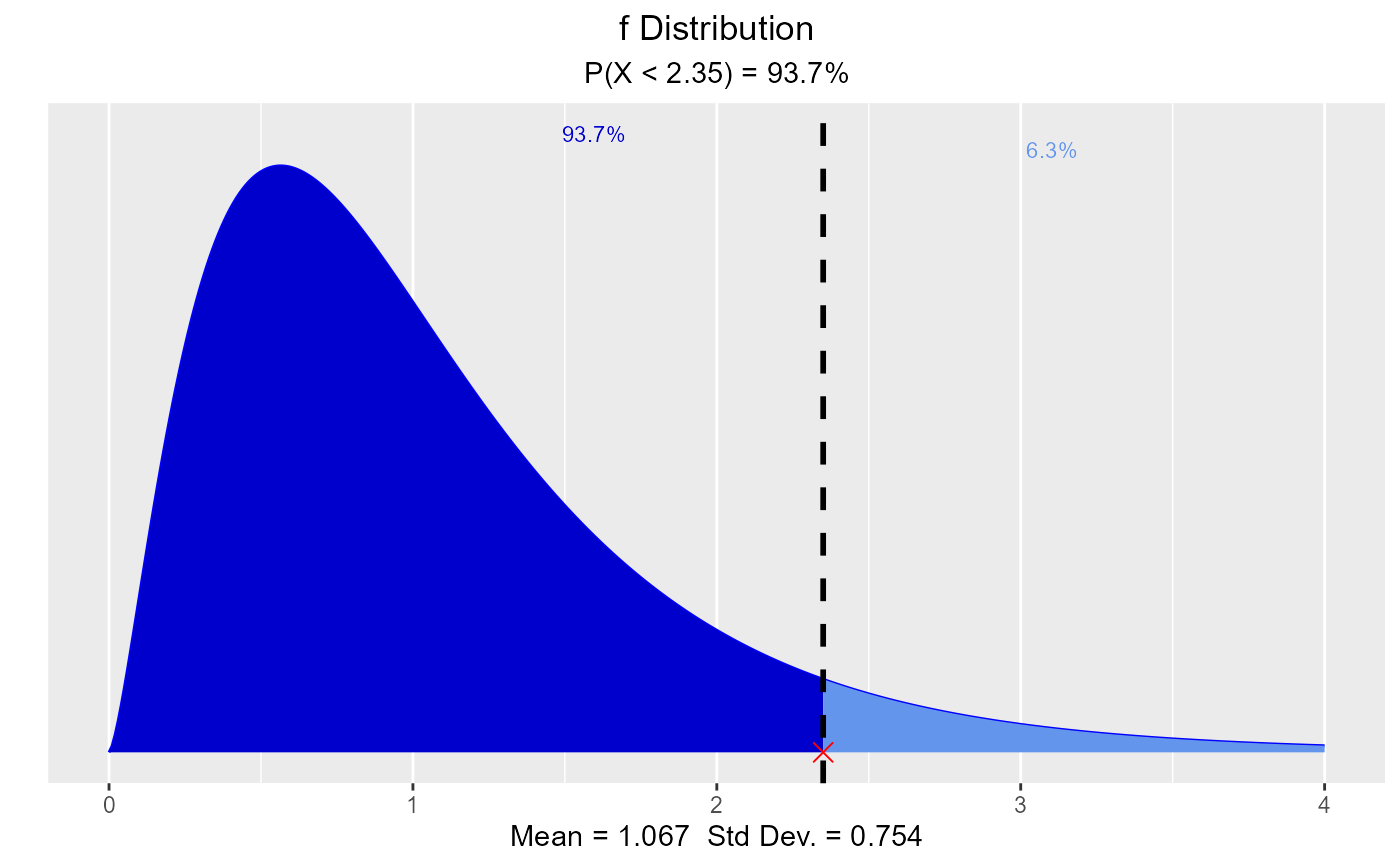
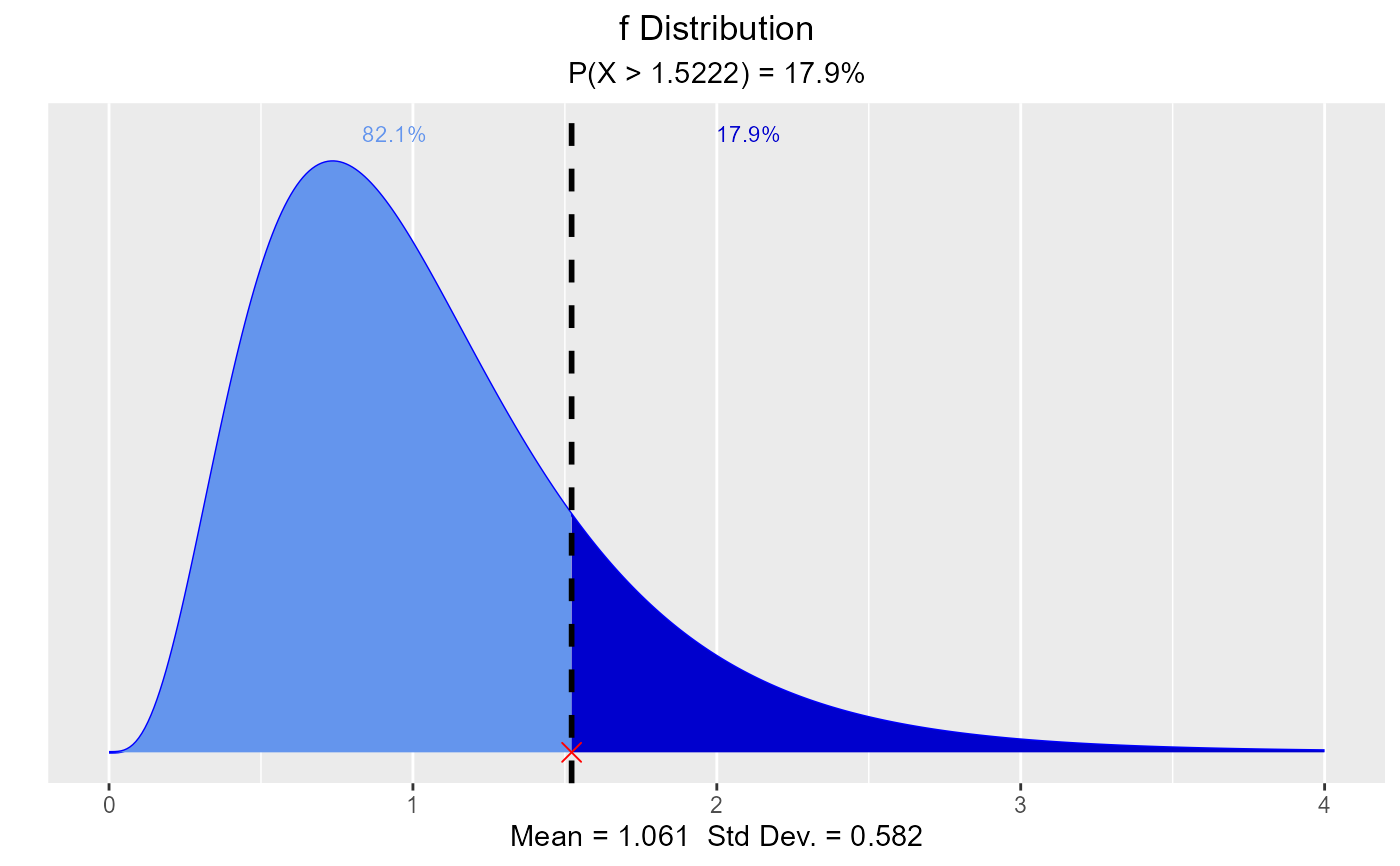
Visualize how changes in degrees of freedom affect the shape of the F distribution. Compute & visualize quantiles out of given probability and probability from a given quantile.
vdist_f_plot(num_df = 4, den_df = 30, normal = FALSE, print_plot = TRUE)

vdist_f_perc(
  probs = 0.95,
  num_df = 3,
  den_df = 30,
  type = c("lower", "upper"),
  print_plot = TRUE
)

vdist_f_prob(
  perc = 2.35,
  num_df = 5,
  den_df = 32,
  type = c("lower", "upper"),
  print_plot = TRUE
)
Arguments
| num_df | Degrees of freedom associated with the numerator of f statistic. |
|---|---|
| den_df | Degrees of freedom associated with the denominator of f statistic. |
| normal | If |
| print_plot | logical; if |
| probs | Probability value. |
| type | Lower tail or upper tail. |
| perc | Quantile value. |
See also
Examples
# visualize F distribution vdist_f_plot()vdist_f_plot(6, 10, normal = TRUE)# visualize probability from a given quantile vdist_f_perc(0.95, 3, 30, 'lower')vdist_f_perc(0.125, 9, 35, 'upper')# visualize quantiles out of given probability vdist_f_prob(2.35, 5, 32)vdist_f_prob(1.5222, 9, 35, type = "upper")