Visualize how changes in number of trials and the probability of success affect the shape of the binomial distribution. Compute & visualize probability from a given quantile and quantiles out of given probability.
Examples
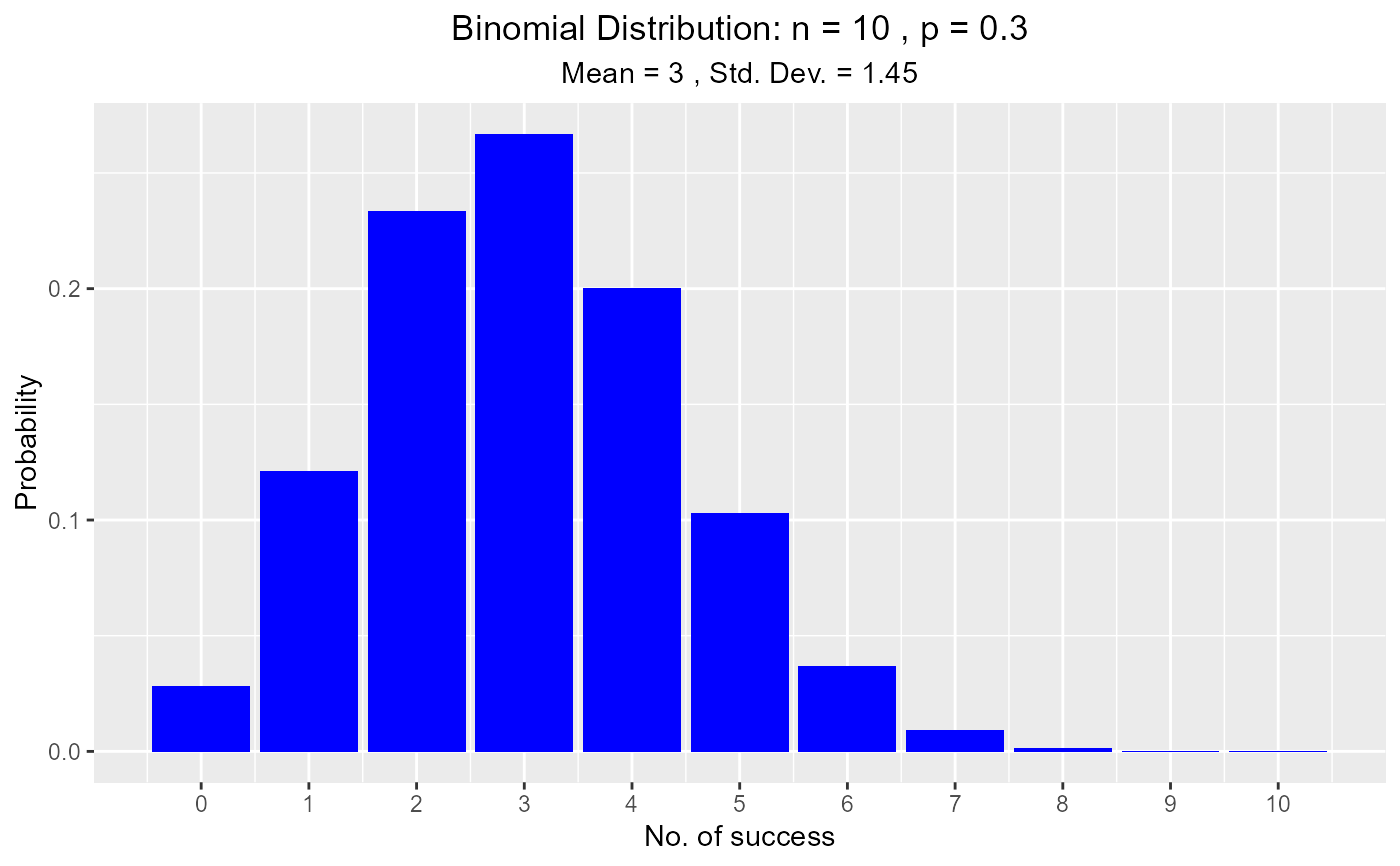
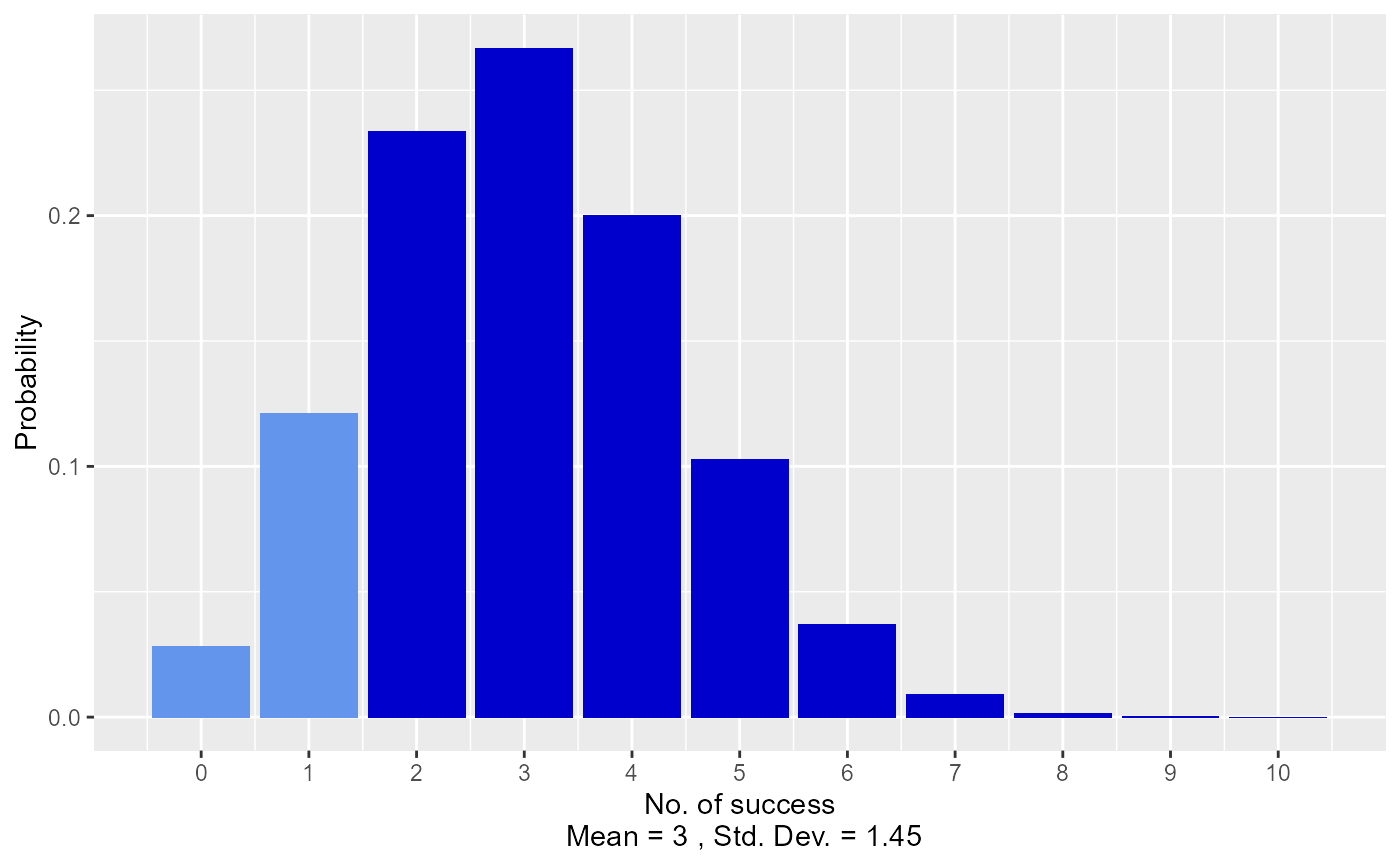
# visualize binomial distribution
vdist_binom_plot(10, 0.3)
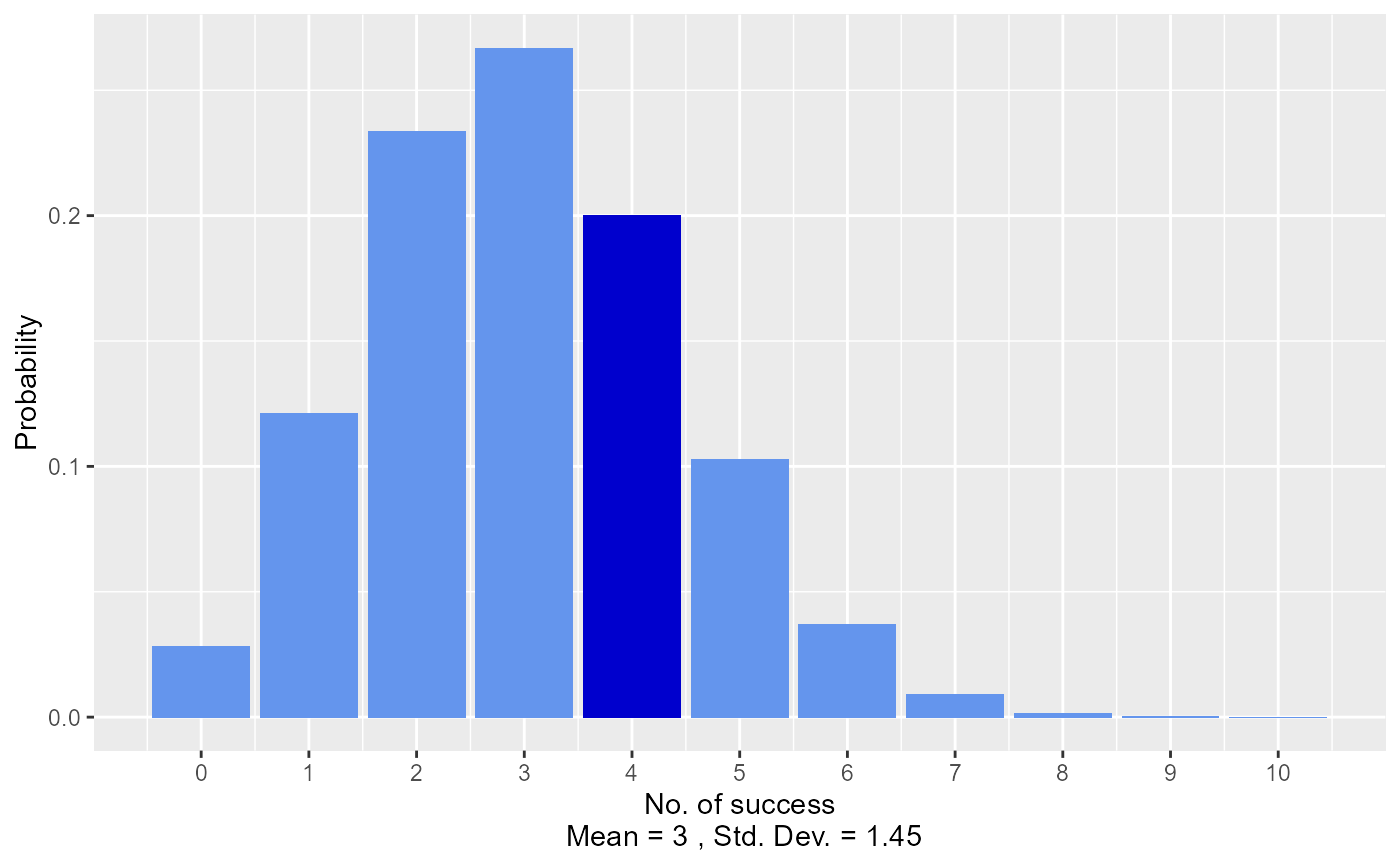
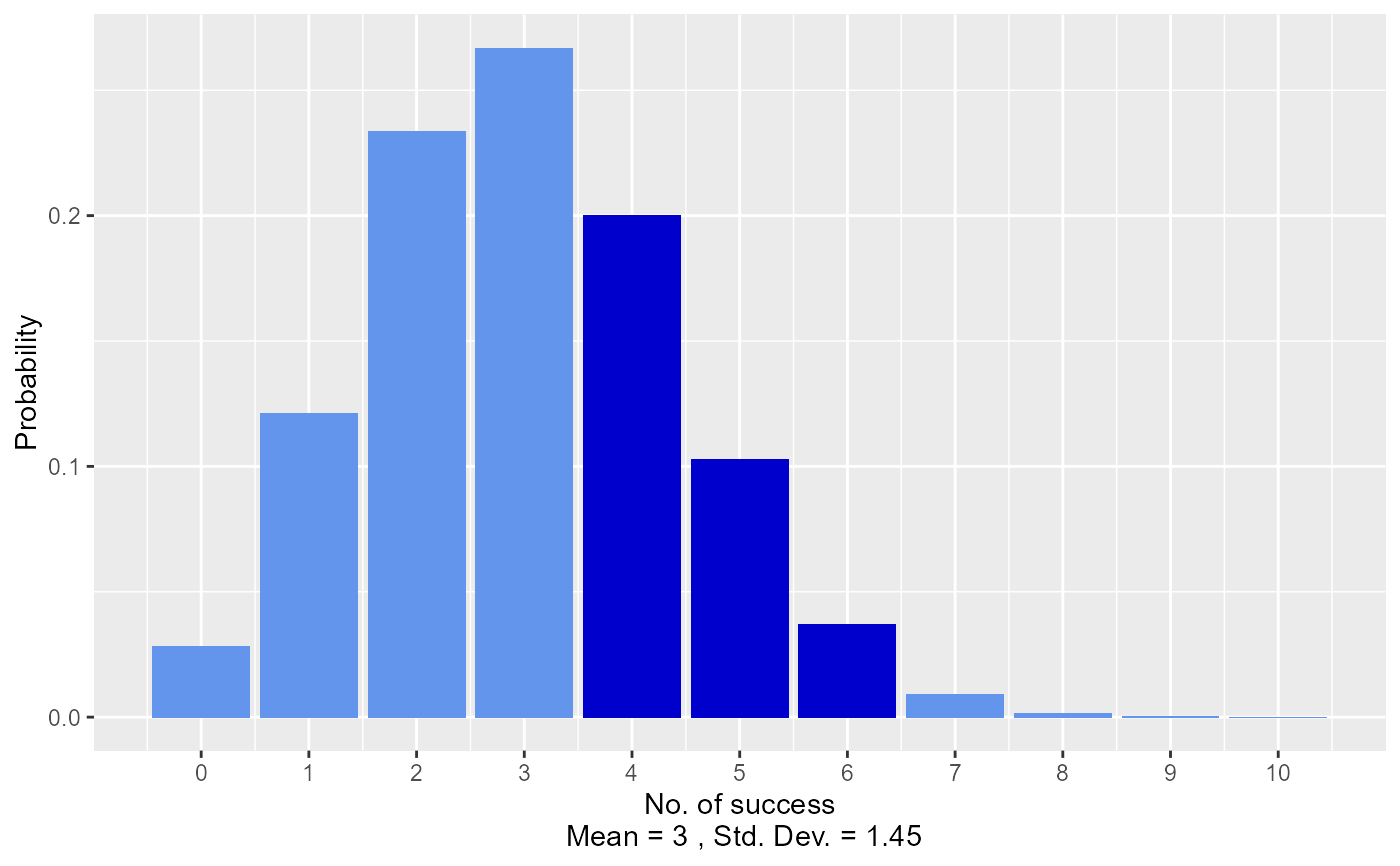
 # visualize probability from a given quantile
vdist_binom_prob(10, 0.3, 4, type = 'exact')
# visualize probability from a given quantile
vdist_binom_prob(10, 0.3, 4, type = 'exact')
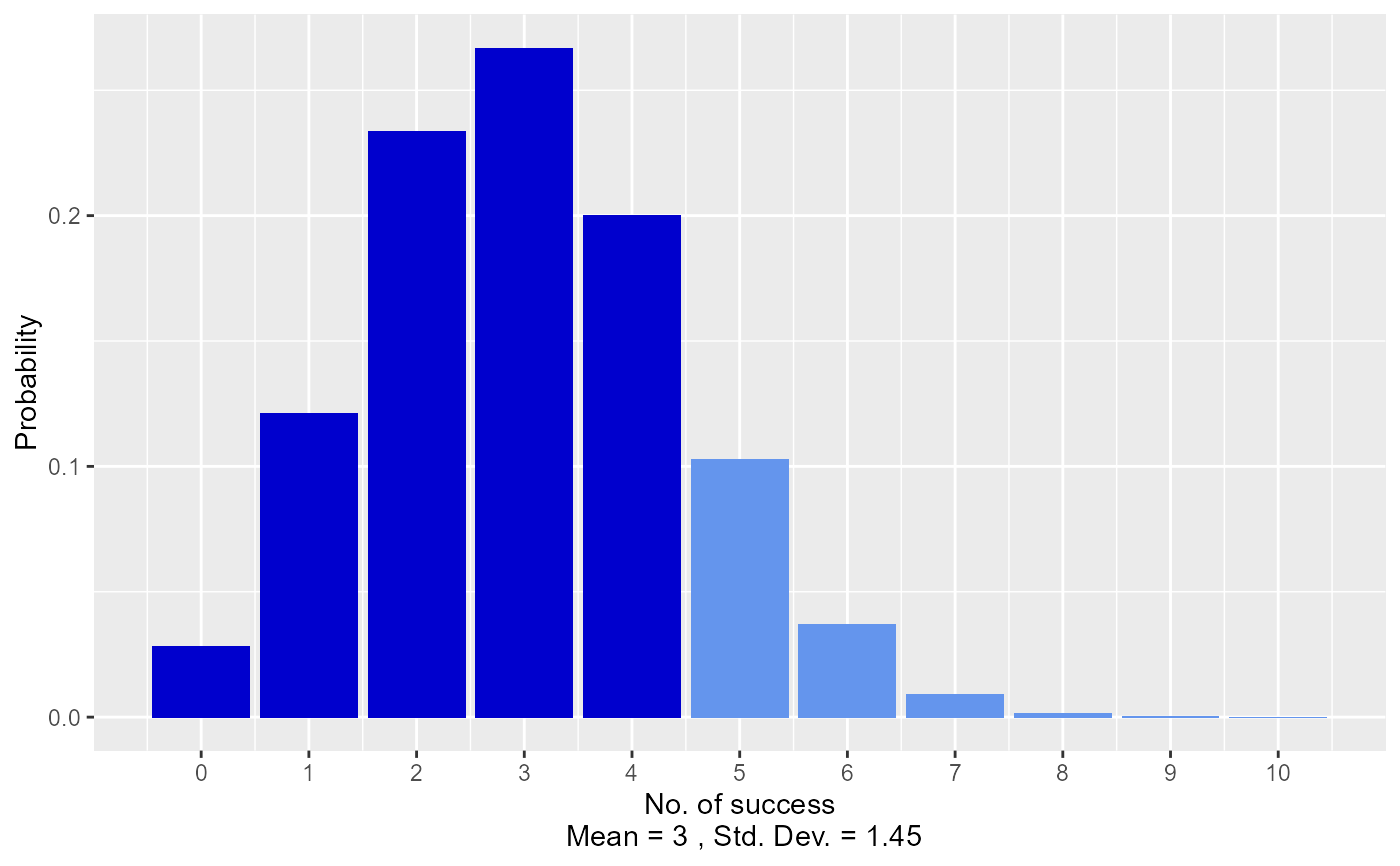
 vdist_binom_prob(10, 0.3, 4, type = 'lower')
 vdist_binom_prob(10, 0.3, 4, type = 'upper')
 vdist_binom_prob(10, 0.3, c(4, 6), type = 'interval')
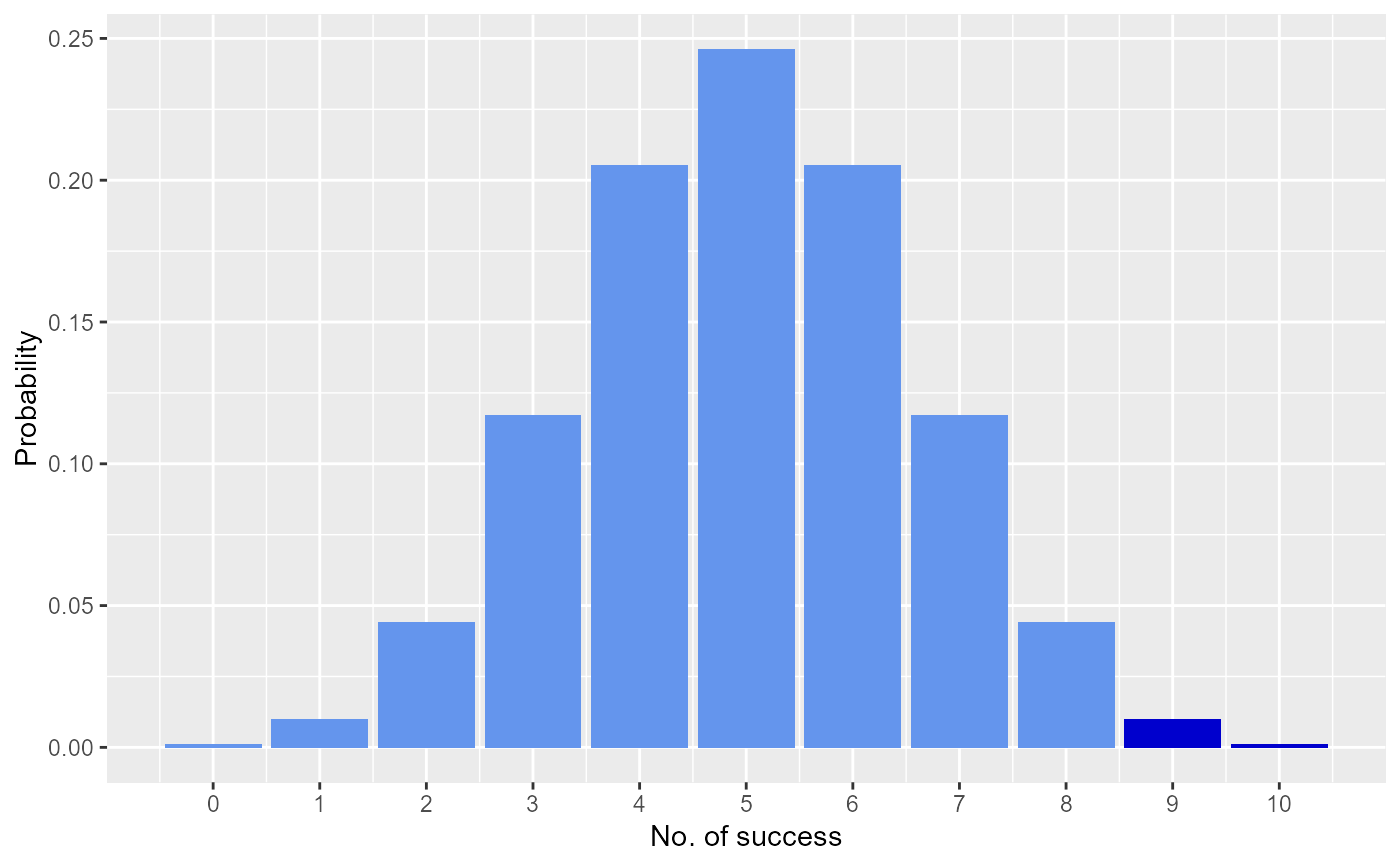
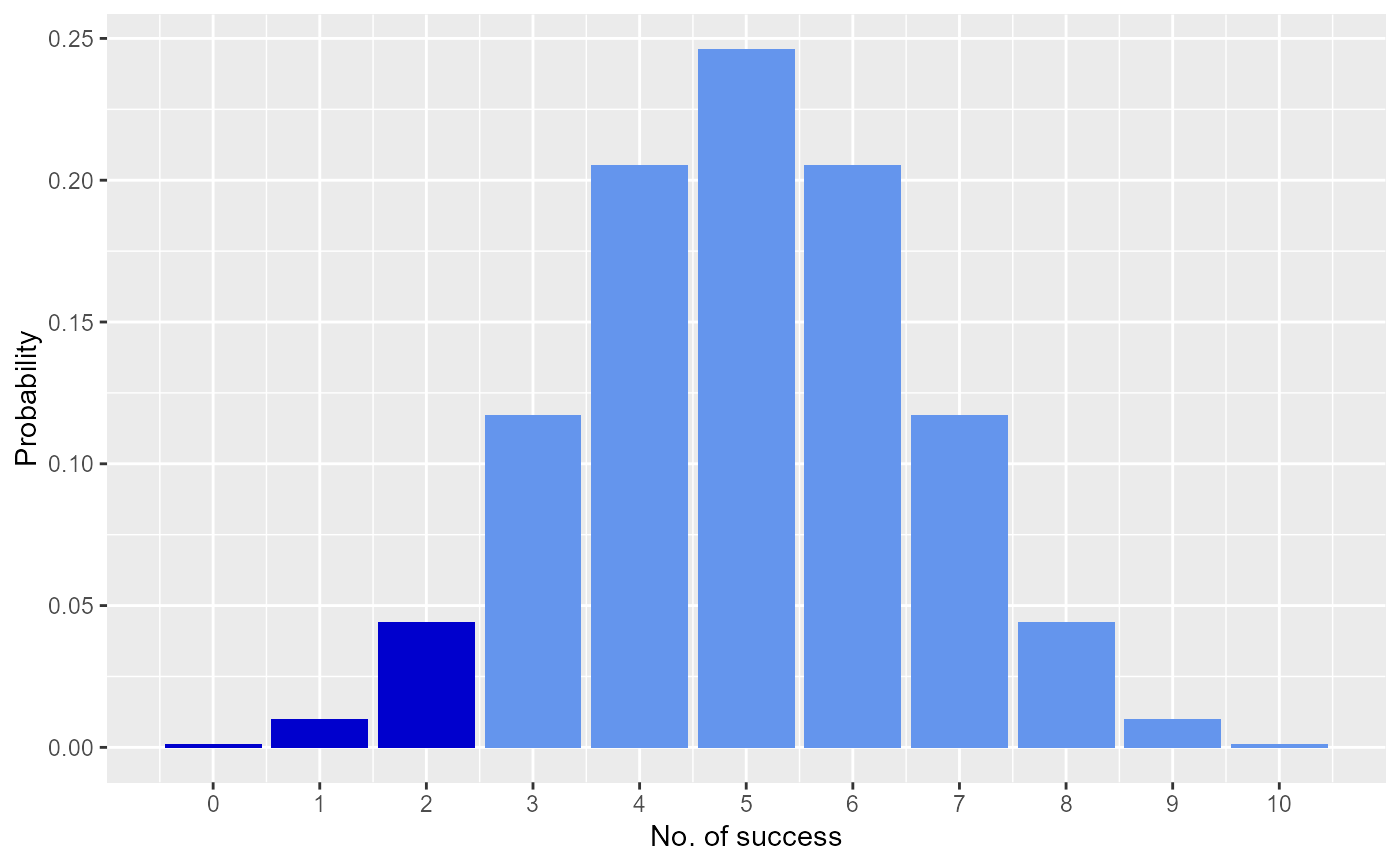
 # visualize quantiles out of given probability
vdist_binom_perc(10, 0.5, 0.05)
# visualize quantiles out of given probability
vdist_binom_perc(10, 0.5, 0.05)
 vdist_binom_perc(10, 0.5, 0.05, "upper")